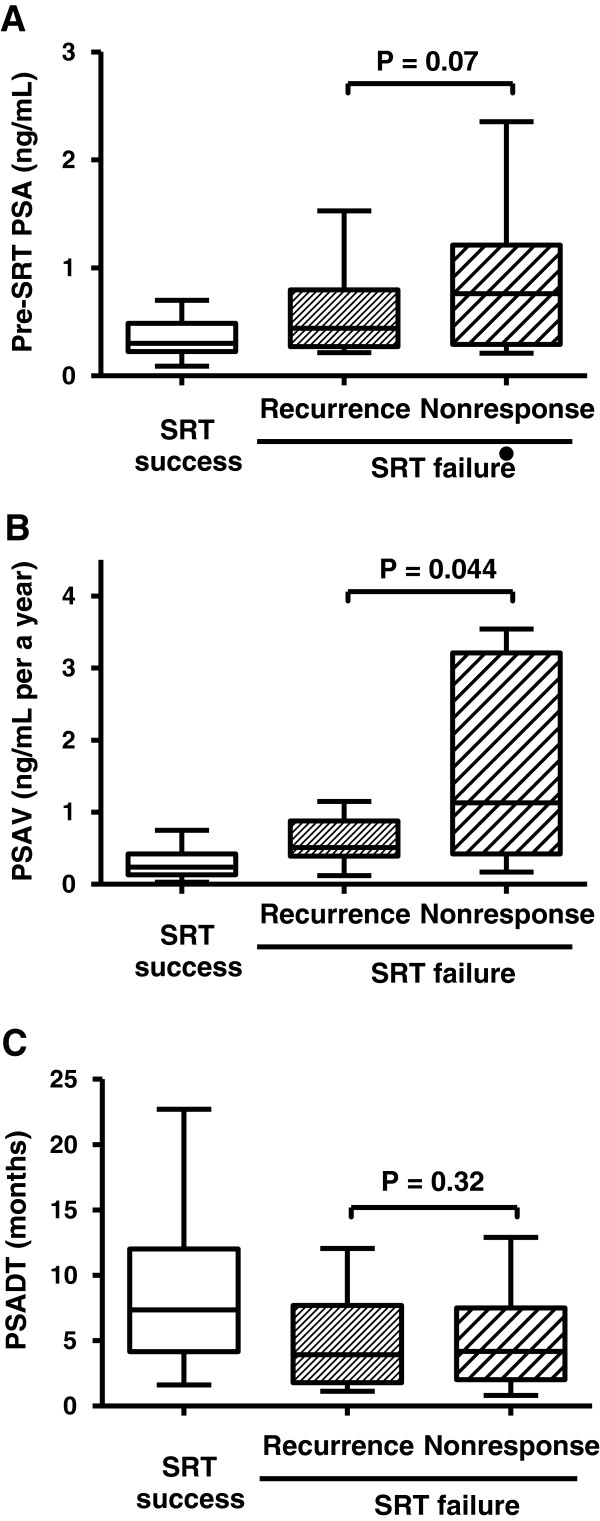
Figure 3.

Comparison of PSA-related values between the SRT success group, recurrence group and nonresponse group. Pre-SRT PSA (A), PSAV (B), and PSADT (C) were depicted by Tukey box plots. Horizontal lines within boxes indicate median levels and are depicted by horizontal lines within boxes. Significance (P < 0.05) was assessed by the Mann–Whitney U test.
