
Figure 3. Analyzing and comparing circulating human leukocyte subsets to murine samples improves gene expression correlations.
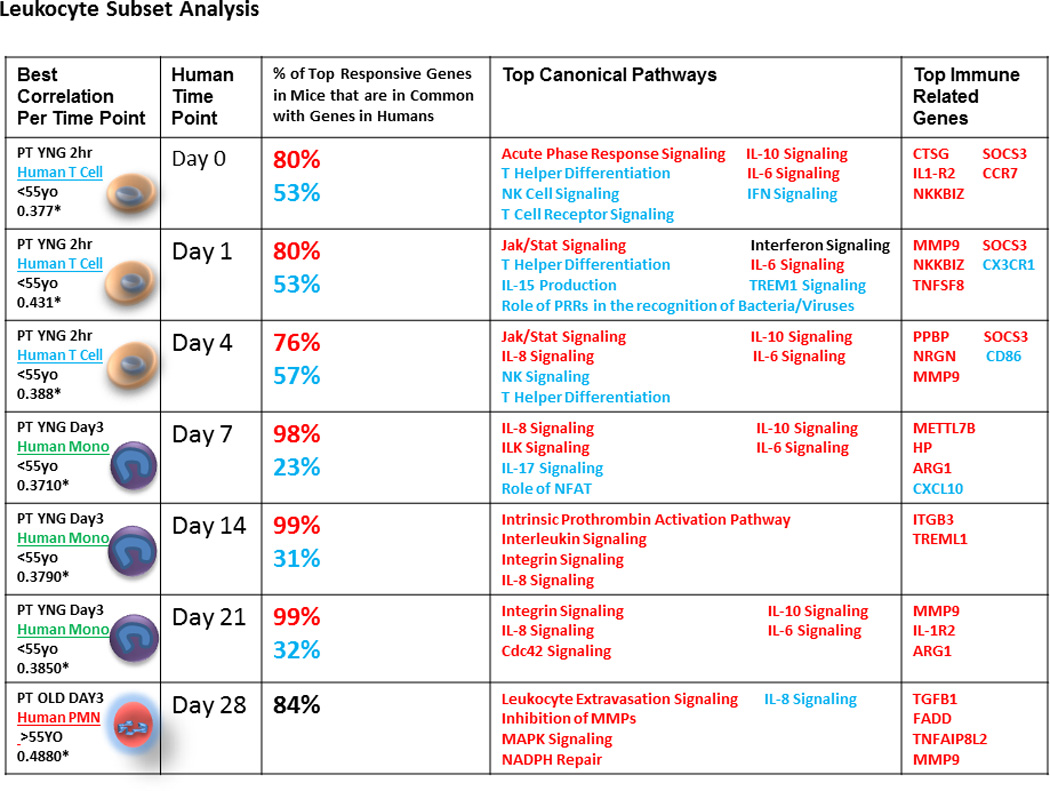
From left to right, columns one and two show the best correlation between murine PT models and human trauma at each human time point. The murine correlations were chosen as the best correlation of total mouse leukocytes from either the 2 hour, 1 day, or 3 day time points and either young or old mice. Asterisks (*) indicate statistically significant correlations (p<0.05 after Bonferroni’s correction). The best human correlations were chosen with regards to patient age (<55 years old or >55 years old) and leukocyte subset (lymphocytes, monocytes, or PMNs). Column three shows the percentage of up-regulated and down-regulated genes in mice that are in common with the top 100 up and down regulated genes in humans at each time point. Column four shows immune related pathways of interest chosen from the top 30 canonical pathways from an IPA analysis of the top 100 up and top 100 down regulated genes in humans. Column five shows the top up and down regulated genes from the same IPA analysis. (Red=up regulated, Blue=down regulated, Black=both up and down regulated).