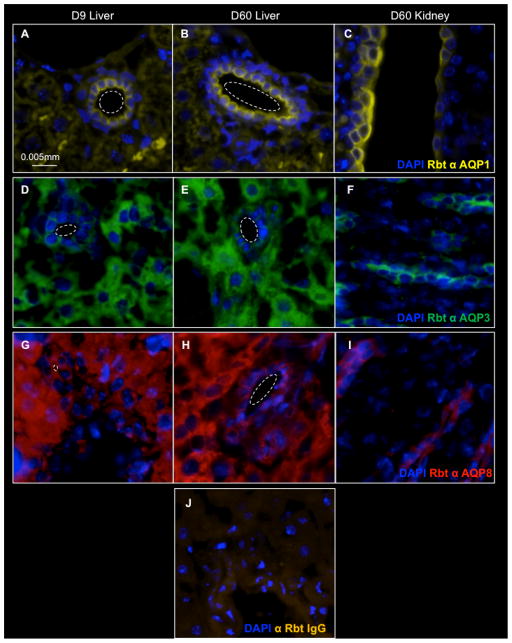
Figure 6. AQP Protein Expression in D9 and D60 Cholangiocytes.
One AQP per group was examined. Dashed lines indicate the luminal space of a bile duct in liver tissue. A–C) Classical AQP1 expression in D9 Liver, D60 Liver, and D60 Kidney. D–F) Aquaglycerol AQP3 expression in D9 Liver, D60 Liver, and D60 Kidney. G–I) Unorthodox AQP8 expression in D9 Liver, D60 Liver, and D60 Kidney. J) D60 liver stained using species matched isotype control antibody.

