
Figure 5.
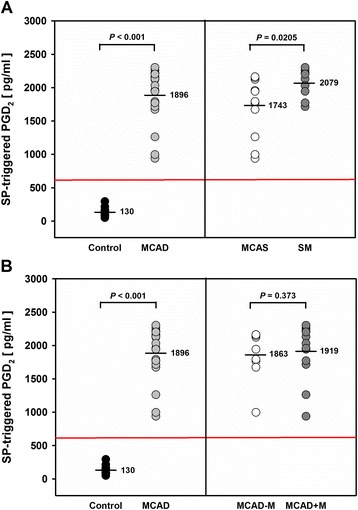
SP-triggered release of PGD 2 from PBLs of MCAD patients. Data represent individual PGD2 levels of MCAD patients and healthy controls, derived group means (black horizontal lines), and the optimal cut-off value (red horizontal line) of 616.38 pg/ml with 0.0% misclassification. Data were statistically analyzed using the Student’s t-test for unpaired values and ROC analysis, respectively. Control: healthy individuals (n = 20), MCAD: patients with mast cell activation disease (n = 22); (A) MCAS: MCAD patients with mast cell activation syndrome (n = 12); SM: MCAD patients with systemic mastocytosis (n = 10); (B) MCAD-M: MCAD patients without MCAD-specific medication (n = 9); MCAD + M: MCAD patients with MCAD-specific medication (n = 13).