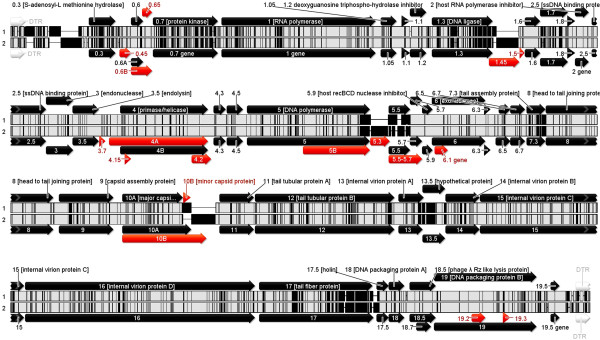
Figure 4.

Progressive mauve alignment of phage AP5 with Yersinia phage φYeO3-12. Inner tracks show regions of DNA sequence similarity (white) interspersed with regions where no sequence similarity exists (black) [26]. The gene arrangement of AP5 (top) and φYeO3-12 (bottom) is displayed in the direction of transcription. Genes depicted in red indicate genes that are dissimilar and or missing from either genome.
