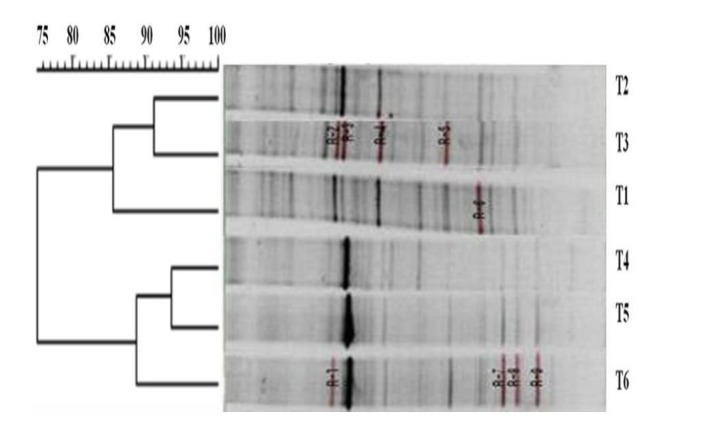
Figure 1.

Negative image and similarity index of 16S rDNA amplified DGGE band profiles using total genomic DNA extracted after 48 h of in vitro rumen fermentation using different ratios of soybean meal and soluble starch. DGGE, denaturing gradient gel electrophoresis; SM, soybean meal; T1 = Control; T3 = SM 7: SS 3; T5 = SM 3: SS 7; SS, soluble starch; T2 = SM 10: SS 0; T4 = SM 5: SS 5; T6 = SM 0: SS 10.
