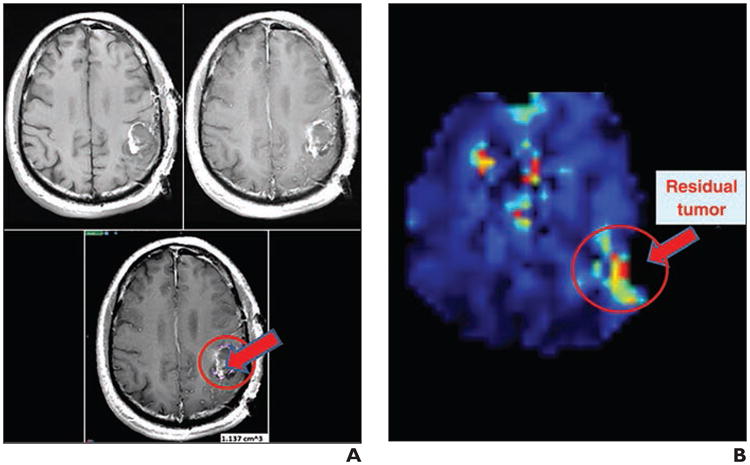
Fig. 2.

Choline (Cho)/N-acetyl aspartate (NAA) ratio map of MR spectrographic image reveals residual tumor (arrow) better than MRI alone in glioblastoma patients after surgical resection.
A, To estimate residual glioblastomas, T1-weighted image (top left) was subtracted from contrast-enhanced T1-weighted image (top right). Difference map (bottom) shows residual tumors marked in purple inside of red circle using Velocity AI program (Velocity Medical Solution).
B, Cho-to-NAA ratio map was calculated using Metabolic Imaging Data Analysis System (University of Miami) and displayed using Velocity AI. Residual tumors based on elevated Cho-to-NAA ratio are indicated by red arrow inside of red circle. Some motion artifacts are shown in lesions of ventricle and sinus in top and center area.
