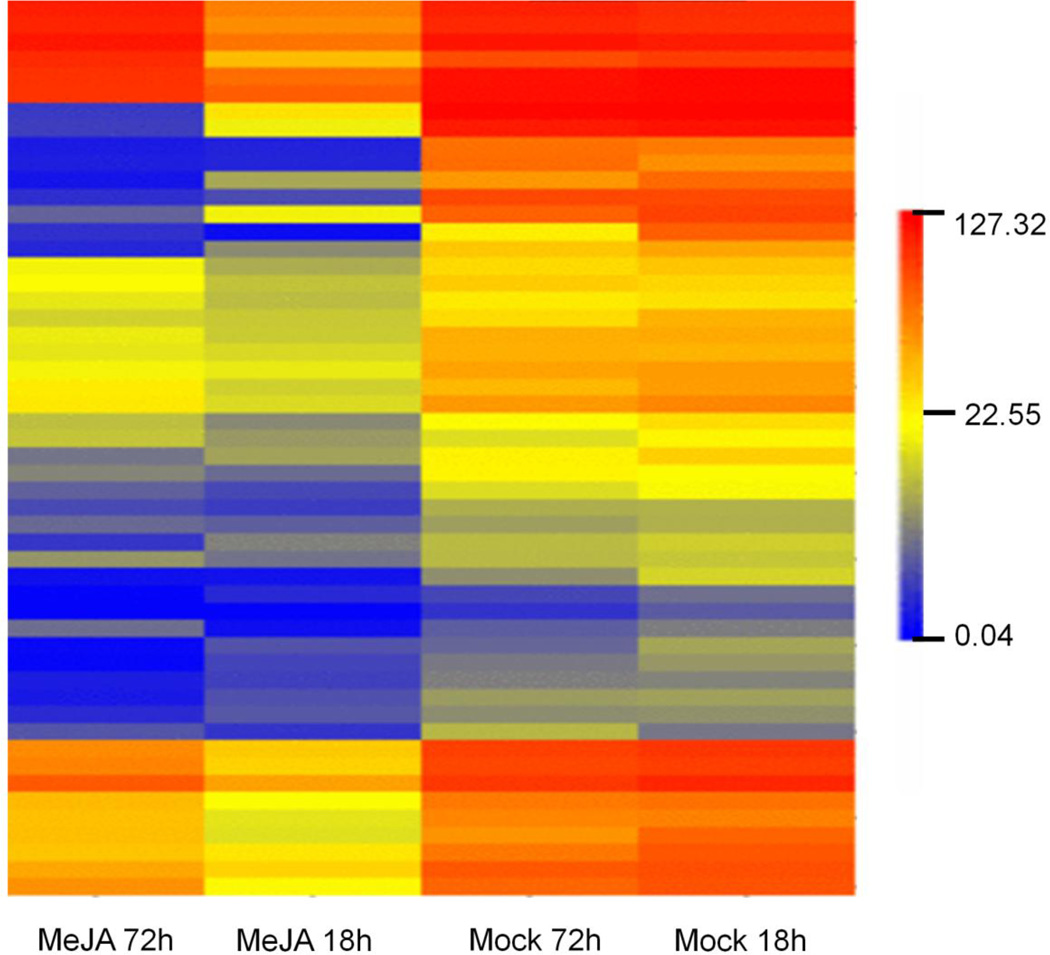
Fig. 6.
Heat map showing expression patterns of significantly downregulated cell cycle related-genes in MeJA-elicited cultures as compared to mock-elicited cultures. Hierarchical clustering was performed using average linkage and Euclidean distance as a measurement of similarity. Changes in gene expression were calculated based on the RPKM values of corresponding genes

