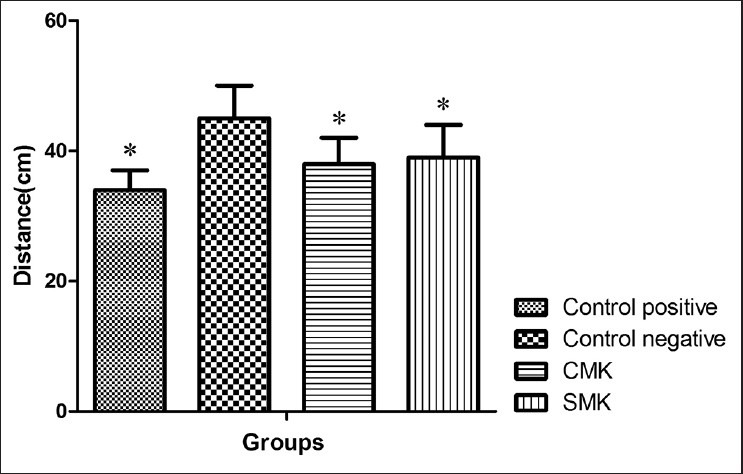
Figure 2.

Comparison of memory retention on Day 6 as represented by the distance to reach the platform region between the control, sham and addicted groups in the Morris Water Maze task, *P < 0.05. Ordinate shows the mean ± standard error of mean of distance (cm) to reach the platform region
