Figure 2.

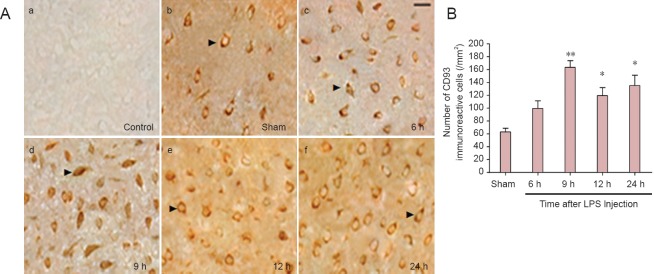
CD93 immunoreactivity and localization in the cerebral cortex of rats with brain inflammation.
(A) Immunohistochemical staining using CD93 antibody in the cerebral cortex of rats with brain inflammation (light microscope). (a) control group; (b) sham surgery (sham) group; (c–f): staining results at 6, 9, 12, and 24 hours after lipopolysaccharide injection. Arrows show CD93-immunoreactive cells. (a) no CD93-immunoreactive signal; (b, e, f) CD93 mainly expressed in cell membrane; (c, d) CD93 expressed in cytoplasm and nuclei. Scare bar: 40 μm. (B) Statistical results of A: each column represents the number of CD93-immunoreactive cells per mm2 at various time points. Compared with the sham group, the number of CD93-immunoreactive cells is higher in experimental groups at various time points. Significant differences are visible at 9, 12, and 24 hours. The number of CD93-immunoreactive cells is greatest at 9 hours. *P < 0.05, **P < 0.01, vs. sham group. Data are expressed as the mean ± SEM with four rats in each group; one-way analysis of variance and the least significant difference tests were performed. LPS: Lipopolysaccharide; h: hours.
