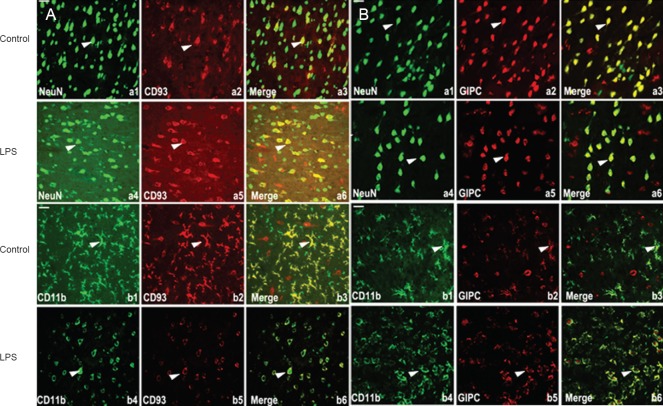
Figure 3.
Localization of CD93 and GIPC in the central nervous system of rats with brain inflammation (fluorescence microscope).
(A) a1, a4: NeuN-labeled neurons (green); b1, b4: CD11b-labeled microglia (green); a2, a5, b2, b5: CD93 antibody staining (red); a3, a6, b3, b6: merged images (yellow indicates colocalized green and red signal). a2, a5, b2, b5: CD95 is mainly expressed in cell membranes of microglia and neurons; compared with b3, microglia show bigger volumes, rounder shapes, and activated phenotypes; CD93-positive signal is obviously weakened. (B) a1, a4: NeuN-labeled neurons (green); b1, b4: CD11b-labeled microglia (green); a2, a5, b2, b5: GIPC antibody staining (red); a3, a6, b3, b6: merged images (yellow indicates colocalized green and red signal). a2, a5, b2, b5: GIPC extensively expressed in the cell membrane and cytoplasm of microglia and neurons; compared with controls, GIPC localization was not significantly altered. Arrows show NeuN-, CD11b-, CD93- and GIPC-positive signals, and colocalized signals in overlay chart. Scare bars: 40 μm. LPS: Lipopolysaccharide. GIPC: GAIP-interacting protein, C terminus.

