
Figure 3.
SOCS6 acts via YAP
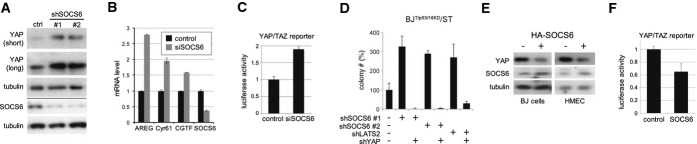
- Effect of depleting SOCS5/6 on YAP1. BJT/p53/p16KD/RasV12/ST cells were transduced to express two independent shRNAs targeting SOCS6 or with empty vector. Blot probed with anti-YAP1. Anti-tubulin was used to control for loading. Below the line: Blot probed with anti-SOCS6 in a separate experiment.
- Quantitative real-time RT–PCR to measure YAP target levels in BJT/p53/p16KD/ST cells. Cells were treated with siRNA to deplete SOCS6 or with a scrambled control siRNA. The efficacy of SOCS6 depletion is shown at right. Error bars: mean ± SD for three independent experiments. Increased expression of the YAP targets was significant comparing SOCS6-depleted and control cells (ANOVA: P < 0.0001).
- Luciferase reporter assay. The 8× GTIIC luciferase reporter, containing 8 TEAD binding sites (Dupont et al, 2011), was used to monitor YAP/TAZ activity in HEK cells. Cells were transfected with siRNA to deplete SOCS6 or with a control siRNA. Data were normalized to co-transfected Renilla luciferase to control for transfection efficiency and to the empty vector control. Histogram: average of three independent experiments ± SD. P < 0.01 comparing SOCS6-depleted and control cells.
- Effect of co-depleting SOCS5/6 and YAP1 on colony formation. BJT/p53/p16KD/RasV12/ST cells were transduced to express shRNAs targeting SOCS6 or LATS2 with or without shRNA targeting YAP1. Colony number: average of three independent experiments, represented as % of control ± SD. P < 0.01 comparing sh-SOCS6#1 or #2 to control, P < 0.001 comparing sh-SOCS6#1 or #2 with and without shYAP. P < 0.05 comparing shLATS to control and shLATS with shYAP.
- Effect of SOCS6 overexpression on YAP1. BJT/p53/p16KD/RasV12/ST and HMECT/p53/p16KD/RasV12/ST cells were transduced to express HA-tagged SOCS6 or with an empty vector. Blots probed with anti-YAP1 and anti-tubulin.
- Luciferase reporter assay. HEK cells were transfected to express HA-SOCS6 or with empty vector as a control. Data were normalized to co-transfected Renilla luciferase to control for transfection efficiency and to the empty vector control. Histogram: average of three independent experiments ± SD. P < 0.05 comparing SOCS6-overexpressing cells to the vector control.
Source data are available online for this figure.