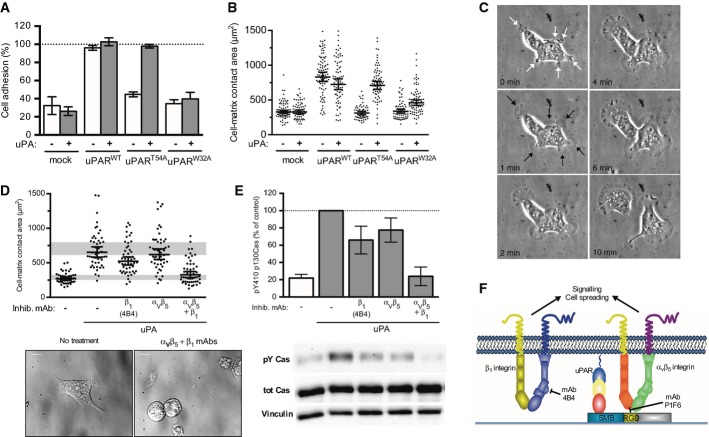
Figure 1. uPAR-mediated VN adhesion triggers signalling and cell spreading through αvβ5 and β1 integrins.
A VN adhesion of cells expressing uPAR variants in the presence or absence of uPA. Mock-, uPARWT- and uPART54A-transfected 293 cells were plated for 30 min on VN with or without uPA. Adherent cells were fixed and stained with crystal violet. VN adhesion is presented in percentage of cell adhesion to poly-D-lysine (PDL shown as 100%). The data are from three independent experiments and are presented as the mean ± s.e.m.
B Increased cell-matrix contact area upon uPAR-mediated VN adhesion. Cells were grown overnight and stimulated for 30 min with uPA. After fixation, DIC images were taken, and cell areas were quantified using ImageJ software. The figure shows the contact areas of individual cells (n = 56–93) taken from two independent experiments. Whiskers indicate the geometric mean and 95% confidence intervals (95% CI) for each condition.
C Selected frames from a time-lapse phase contrast recording of 293/uPART54A cells after the addition of uPA. Membrane ruffles/processes are indicated by white arrows and rapidly convert into lamellipodia, indicated by black arrows, which progressively expand and lead to the acquisition of a migratory phenotype. The complete time-lapse recording can be found in Supplementary Movie S1.
D, E uPAR/VN signalling and cell spreading require integrins. 293/uPART54A cells were seeded on VN for 30 min with uPA and treated with the indicated antibodies. After lysis or fixation, cell-matrix contact areas (D) and phosphorylation of p130Cas SD (E) were assayed and quantified. Cell-matrix contact area measurements represent at least 50 cells with indicated geometrical means ± 95% CI, in two independent experiments. Some cells (n = 4) with contact areas exceeding the chosen y-axis range are not shown. The grey bars represent the range of cell area of not spread or fully spread uPART54A cells based on 95% CI on poly-D-lysine or on VN with uPA, respectively (Fig 2B). Representative DIC images are shown (scale bar: 10 μm). Western blot data are represented as percentage of phosphorylated p130Cas SD of cells treated with uPA on VN (n ≥ 3, mean ± s.e.m.). Representative blots for phosphorylated p130Cas (pY Cas), total p130Cas (tot cas) and vinculin are shown.
F Cartoon illustrating the signalling downstream of uPAR mediated by αvβ5 and β1 integrins.

