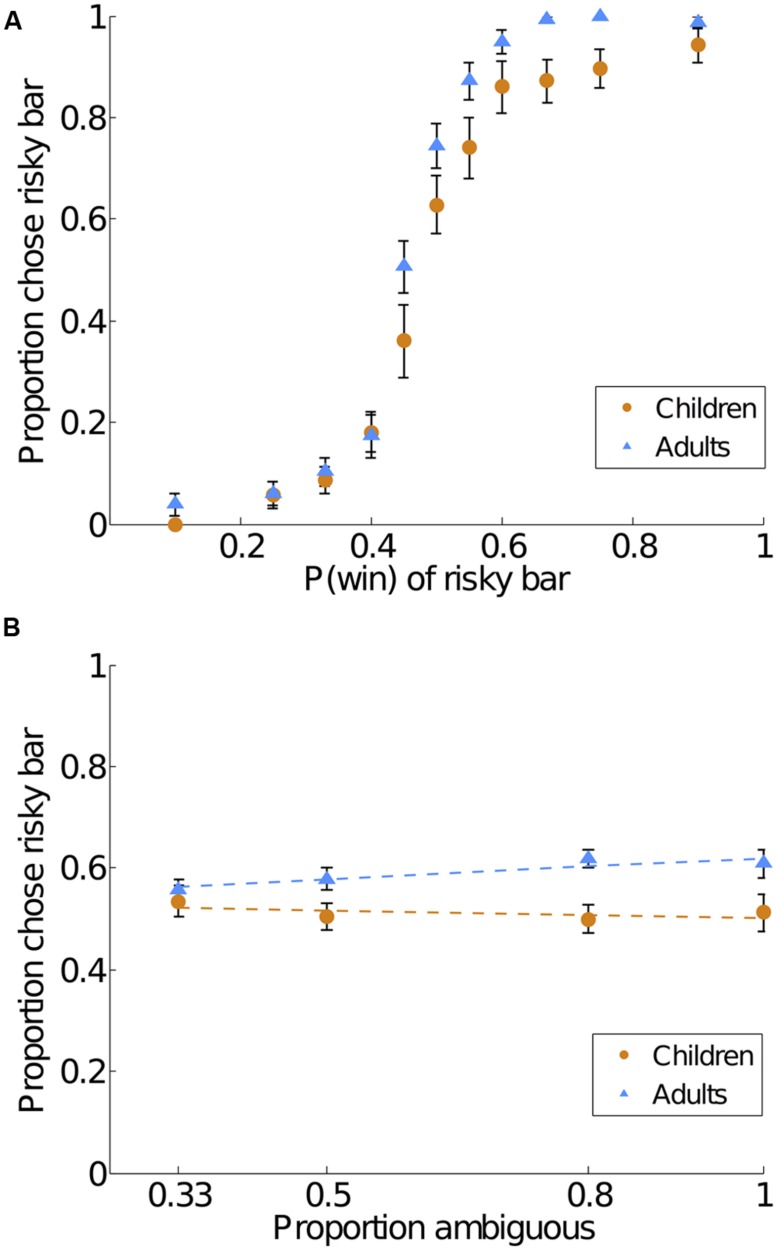
FIGURE 3.
Ambiguity aversion in children and adults at different levels of risk and amounts of ambiguity. Note that these are the same data as Figure 2A, replotted here for illustrative purposes. (A) Frequency of choosing the risky bar on risky bar versus ambiguous bar trials, plotted by the risky bars’ probability of winning. (B) Frequency of choosing the risky bar on risky bar versus ambiguous bar trials, plotted by the ambiguous bars’ proportion of ambiguity. Error bars indicate SE of the mean. Dotted lines indicate linear regression fits.

