
Figure 4.
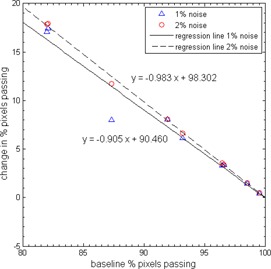
Plot showing the relationship between baseline passing rate and change in passing rate due to added noise for comparisons performed with OMNIPro I'mRT . The slopes shown are statistically significant ( for F‐test for simple linear regression).