Figure 2.

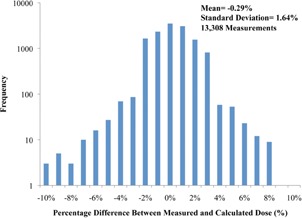
Point dose percent differences (measured versus calculated) for all measurements according to frequency on a logarithmic scale (six measurements outside the range are not shown).

Point dose percent differences (measured versus calculated) for all measurements according to frequency on a logarithmic scale (six measurements outside the range are not shown).