
Figure 3.
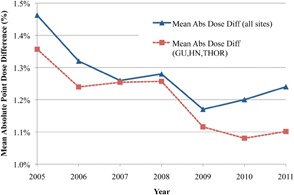
Difference in mean point dose differences by year for all treatment sites versus the three largest sites (HN, GU, and THOR) with connecting lines used for clarity.
Official websites use .gov
A
.gov website belongs to an official
government organization in the United States.
Secure .gov websites use HTTPS
A lock (
) or https:// means you've safely
connected to the .gov website. Share sensitive
information only on official, secure websites.
Difference in mean point dose differences by year for all treatment sites versus the three largest sites (HN, GU, and THOR) with connecting lines used for clarity.