Figure 3.

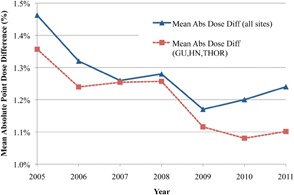
Difference in mean point dose differences by year for all treatment sites versus the three largest sites (HN, GU, and THOR) with connecting lines used for clarity.

Difference in mean point dose differences by year for all treatment sites versus the three largest sites (HN, GU, and THOR) with connecting lines used for clarity.