
Figure 6.
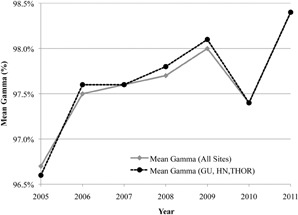
Mean percentage of pixels passing the 5%/3 mm gamma criteria by year for all treatment sites versus the three largest sites (HN, GU, and THOR).
Official websites use .gov
A
.gov website belongs to an official
government organization in the United States.
Secure .gov websites use HTTPS
A lock (
) or https:// means you've safely
connected to the .gov website. Share sensitive
information only on official, secure websites.
Mean percentage of pixels passing the 5%/3 mm gamma criteria by year for all treatment sites versus the three largest sites (HN, GU, and THOR).