
Fig. 5.
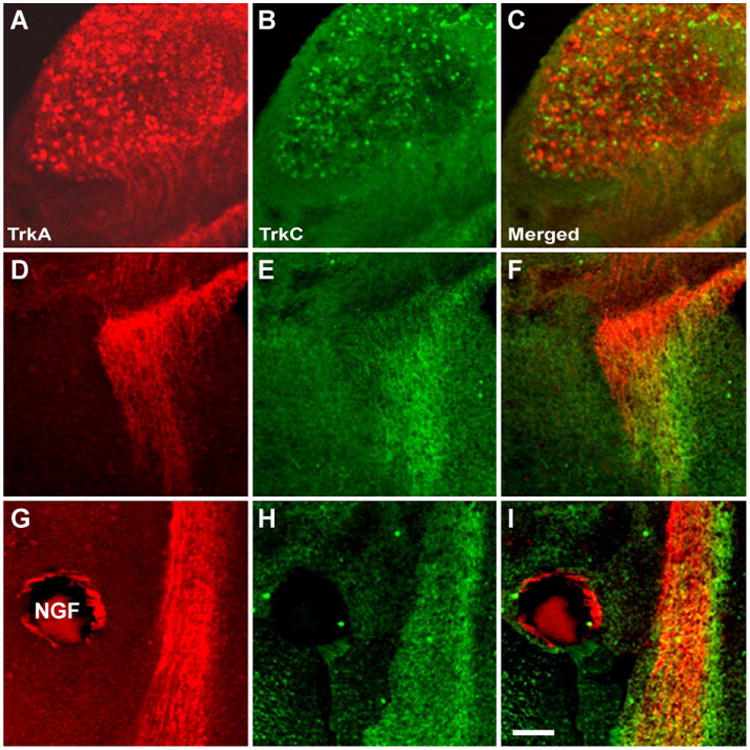
TrkA and TrkC double immunocytochemistry. (A) TrkA and (B) TrkC expression in the same TG from a TG-brainstem wholemount culture with an NGF-bead. Merged images are shown in (C), (F) and (I). Different populations of cells are labeled with either antibody, and there are hardly any cells that express both receptors. (D) and (E) illustrate the initial (rostral) part of the central trigeminal tract, and (G) and (H) at the level of an NGF-loaded bead. Note that at all levels of the tract different populations of trigeminal axons express TrkA and TrkC. Scale bar=100 μm.