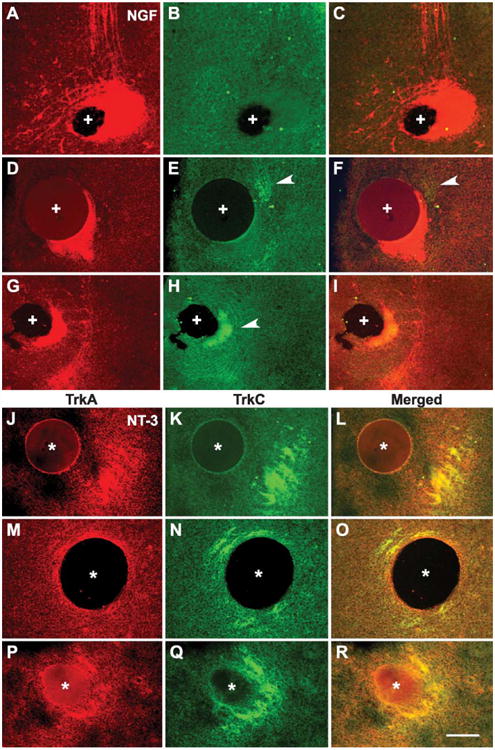
Fig. 6.

Examples of TrkA and TrkC-labeled axons with respect to neurotrophin bead. (A–I) show TrkA and TrkC-labeled axons with respect to an NGF bead from three different cases. Note that mostly TrkA-labeled axons are around the NGF bead (marked with +). While in some cases there are no TrkC-positive axons (A–C), in others, few axons are seen in the vicinity of the bead (D–I, arrow heads). (J–R), show the presence of both TrkA and TrkC-positive axons near NT-3-loaded beads (marked with *). Since these are cryostat sections through the explants, the size of the bead, and the density of the labeled fibers appear different for each case due to the level of section through the explant. Scale bar=100 μm.
