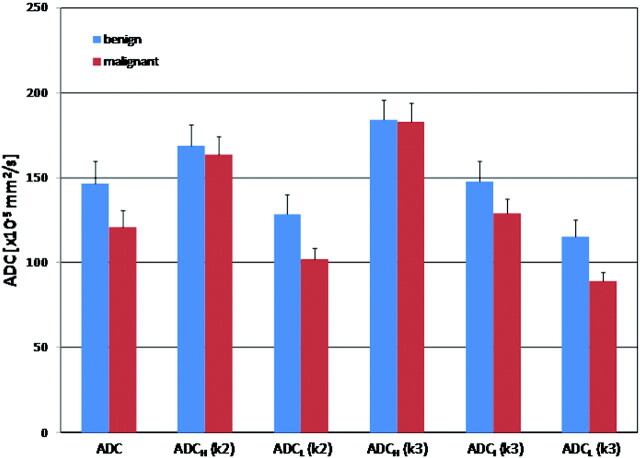
Fig 3.
Bar graphs of whole-tumor ADC, ADCH(k2), ADCL(k2), ADCH(k3), ADCI(k3), and ADCL(k3) obtained from the observations of reader 1 for benign and malignant pathologies are depicted. Significant difference in means are only identified between the ADCL(k3) in benign and malignant lesions (P = .03). For reader 2, significant differences are identified in both the ADCL(k2) and ADCL(k3) clusters (P = .04 and 0.022, respectively) (k2–2-cluster model; k3–3-cluster model).

