
Figure 1.
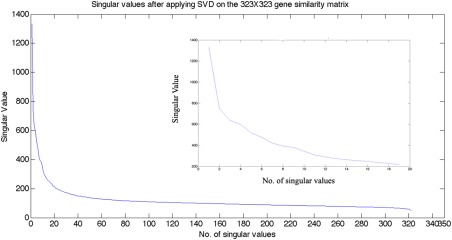
Singular Values after applying SVD on the braingene × gene matrix. It is observed that the singular values level off at around the 20th value. [Color figure can be viewed in the online issue, which is available at http://wileyonlinelibrary.com.]