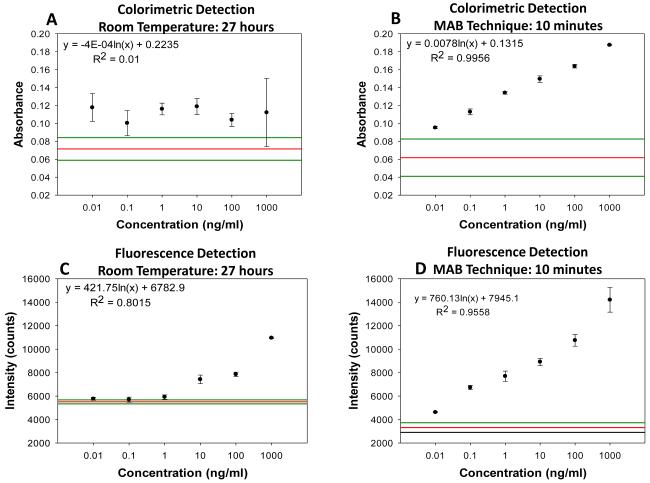
Fig. 3.
Absorbance of DAP obtained from calorimetric bioassay for p53 carried out on circular bioassay platforms at (a) room temperature and (b) using MAB (each step: microwave power level 10 for 20 seconds). Fluorescence intensities obtained from fluorescence based bioassays for p53 carried out on circular bioassay platforms at (c) room temperature and (d) using MAB (each step: microwave power level 10 for 20 seconds). The three horizontal lines indicate the background absorbance (largest, average and lowest values from top to bottom, respectively) obtained from control experiments, where SNFs and p53 were omitted from the bioassays. Please see Figures S1 and S2 in Supporting Information for linear plots and fits for the data presented here.

