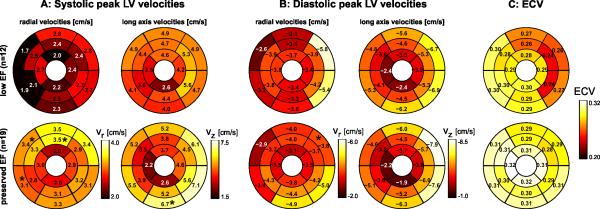
Figure 2.
A: Systolic left ventricular (LV) velocities in patients with non-ischemic heart disease with low EF<50% (n=12) compared to a group of n=19 patients with preserved EF (≥50%). The individual plots show the distribution of peak systolic radial and long-axis myocardial velocities in the AHA 16-segment model. B: Diastolic left ventricular (LV) velocities. C: LV mapping of extracellular volume fraction (ECV) derived from pre- and post-contrast T1-mapping in the same two patient groups. * Significant difference.

