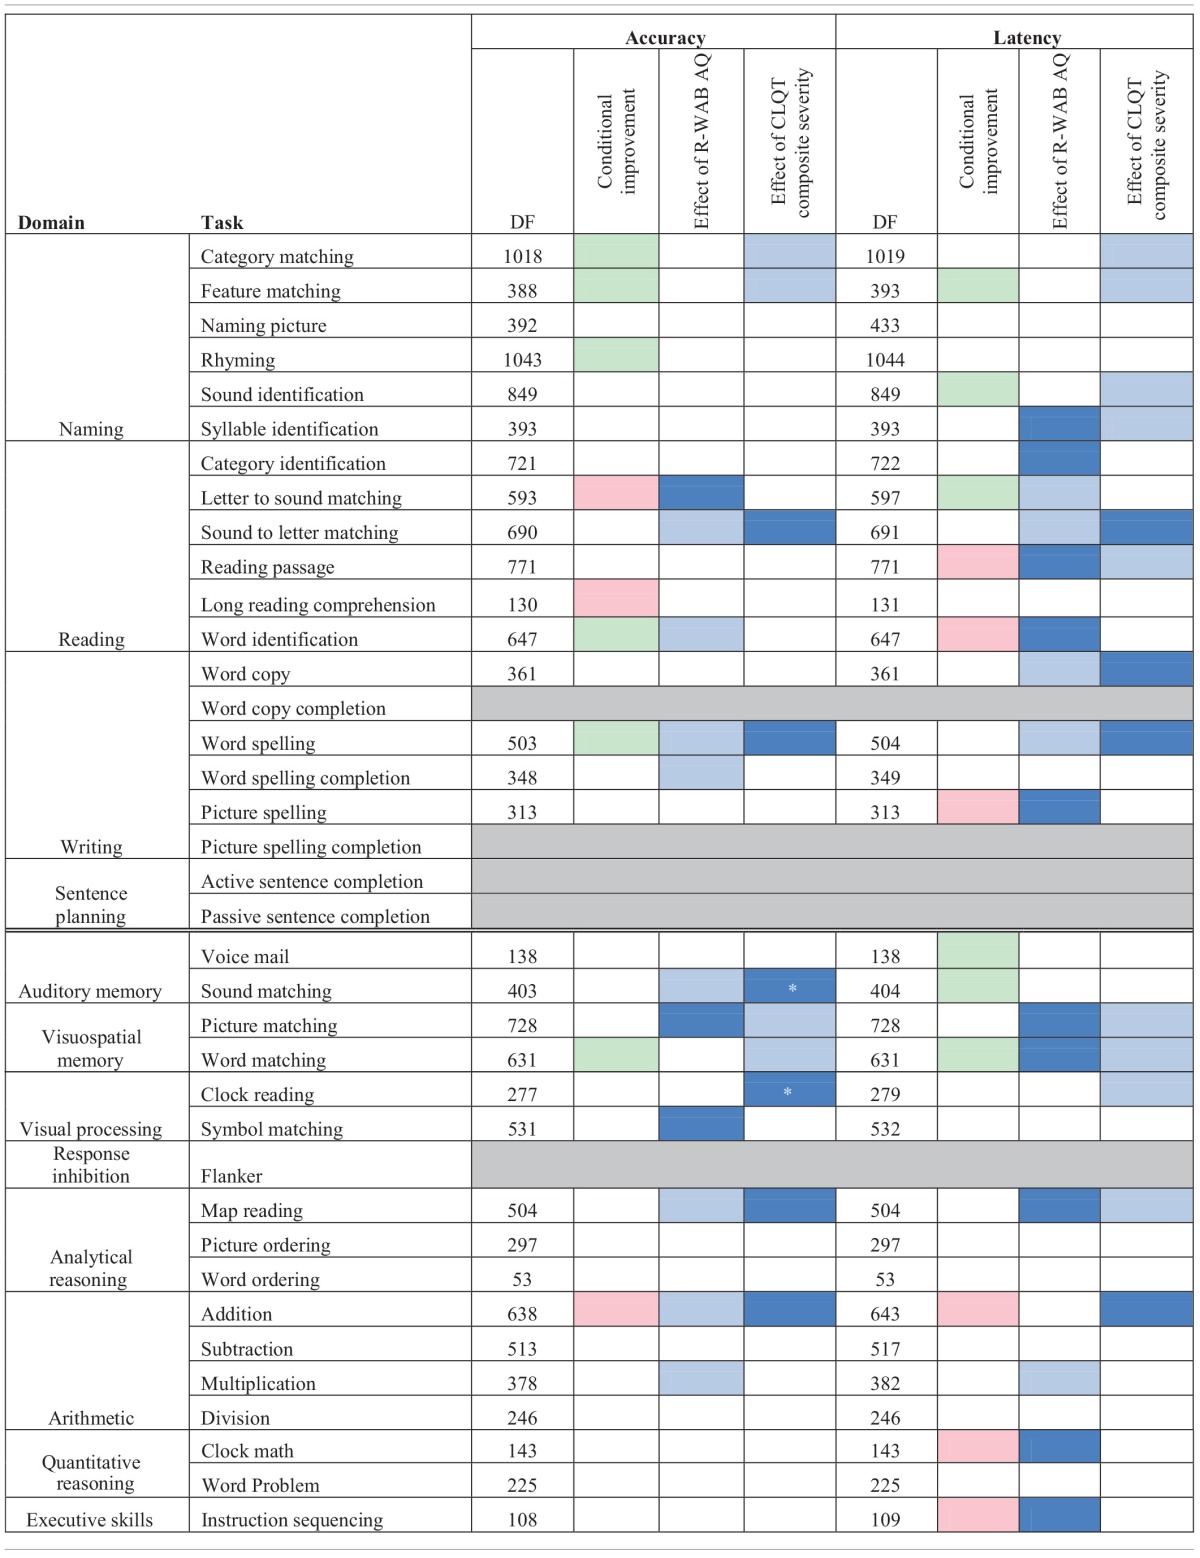
Table 3B.
Accuracy and latency estimate of log odd change per session for mixed model analysis of assisted and scheduled sessions for experimental participants by task.

When the conditional improvement is highlighted in green, it means that overall, experimental participants show beneficial and significant change on that task and when the conditional improvement is highlighted in pink, it means that overall, experimental participants show non-beneficial and significant change on that task, controlling for R-WAB AQ and CLQT Composite Severity. When the effect of R-WAB AQ or CLQT Composite Severity is highlighted in dark blue it means that participants with a higher score than average show more improvement in the task, and when the effect of R-WAB AQ or CLQT Composite Severity is highlighted in light blue it means that participants with a lower score than average show more improvement in the task. Gray highlighting means that there was not enough data from the participants to include in the analysis. A * denotes significance at 0.06 while all other colored cells are significant at the 0.05 level.
