
Table 4B.
Latency results from regression analysis, reporting percentage of participants that had significant slope coefficients that are beneficial out of participants that had significant slope coefficients for all combinations of two tasks (tasks organized by domain).
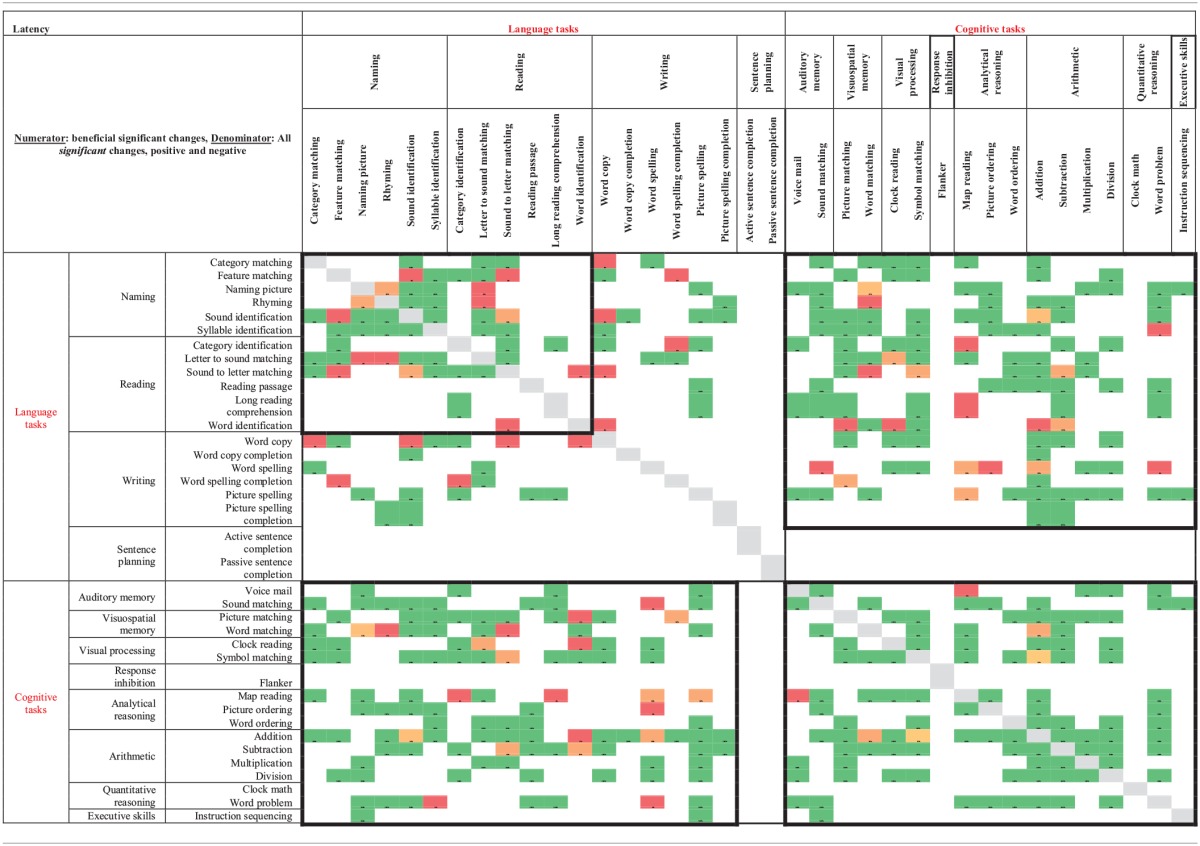
This is calculated based on all colored cells in Tables 2C,D. The denominator of these percentages ranges from one to four. Green denotes that 100% of all significant slope coefficients are positive; orange denotes that 25–75% of all significant slope coefficients are positive; and red denotes that 0% of all significant slope coefficients are positive. Blank cells indicate the tasks were not co-assigned for any participants or if they were co-assigned, the regression was not found to be significant.