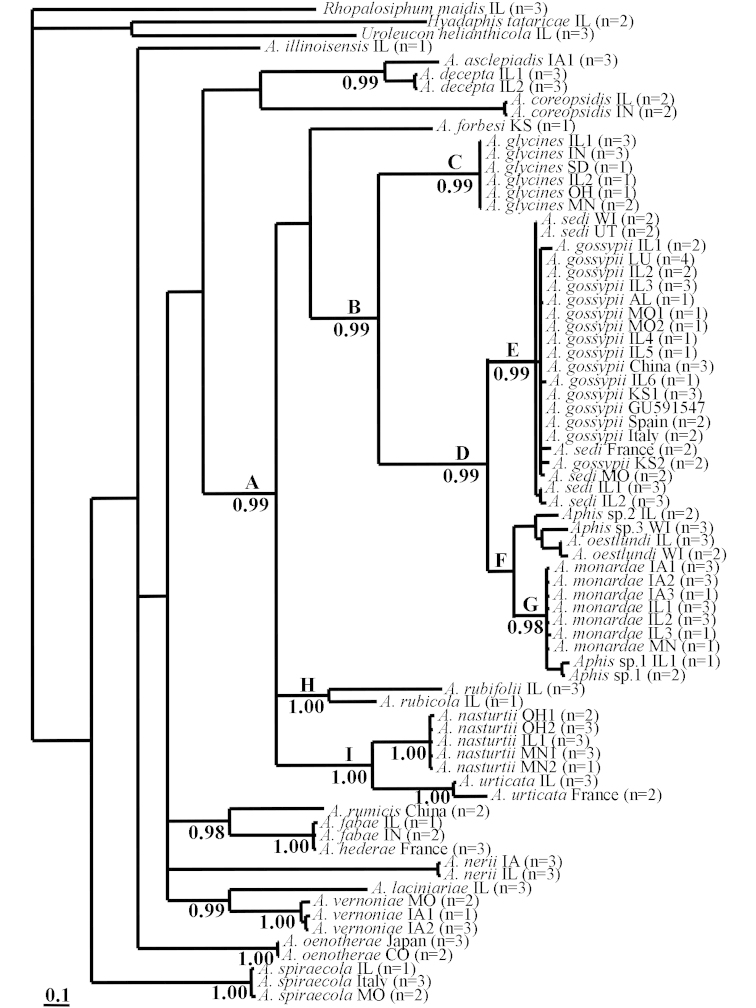
Figure 1.
Cladogram inferred based on analysis of COI with MrBayes. Support values (Posterior Probabilities) are below branches. Values under 0.95 are not presented. Species names are followed by collection locality (USA: AL (Alabama), CO (Colorado), IA (Iowa), IL (Illinois), IN (Indiana), KS (Kansas), LA (Louisiana), MO (Missouri), MN (Minnesota), OH (Ohio), SD (South Dakota), WI (Wisconsin)), and number of haplotypes.

