Fig. 5.
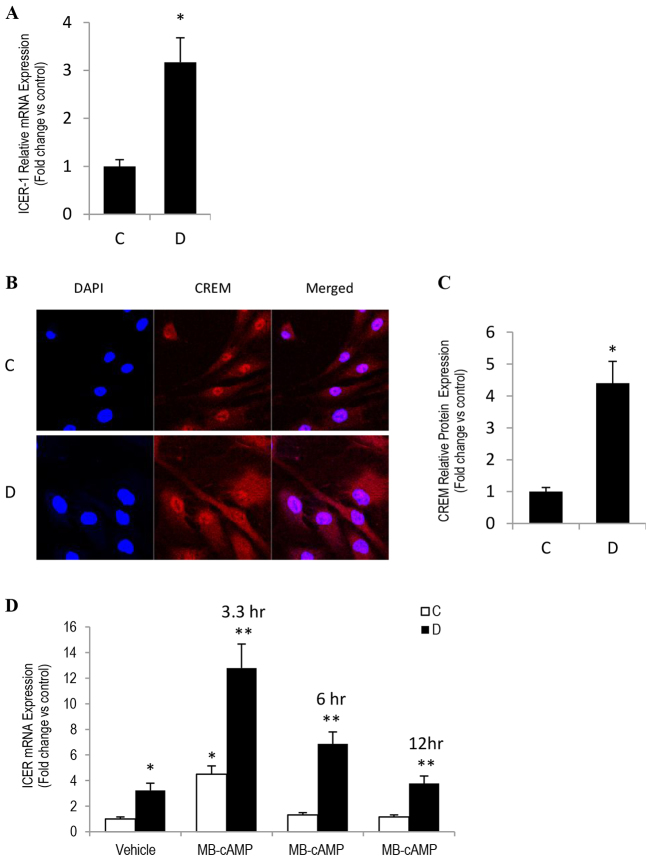
CREM/ICER attenuated CRE-HIF-1α activation in diabetic SIECs. (A) qRT-PCR analysis of CREM/ICER1 mRNA in control and diabetic SIECs. Actin was used as loading control. (B) Representative images of immunofluorescent staining of CREM-1α (CREM) in control and diabetic SIECs. (C) Quantitative measurement of the fold change in the intensity of the CREM-1α fluorescence shown in B. (D) SIECs were incubated in the presence or absence of 100 μM of MB-cAMP for various time intervals, and then ICER mRNA levels were determined by using qRT-PCR. ‘C’, control; ‘D’, diabetic. Results are expressed as means±s.e.m. from three independent experiments. *Significantly different from corresponding control values at P≤0.05. **Significantly different from corresponding MB-cAMP-treated control values at P≤0.05.

