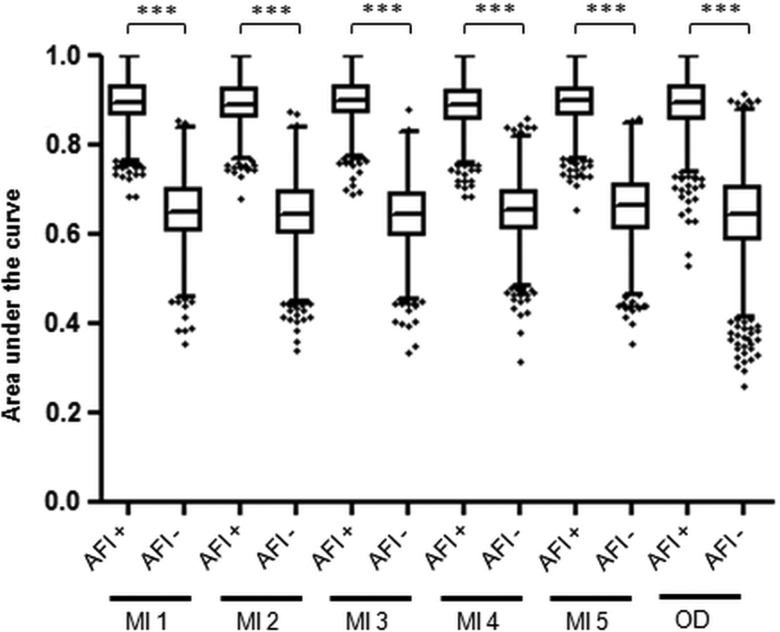
Figure 3.
Diagnostic accuracy for high-grade dysplasia/early cancer (HGD/EC) of the three-biomarker panel assessed on autofluorescence imaging-positive (AFI+) areas and AFI− areas. This analysis was performed on the 114 patients with biopsies available on both AFI+ and AFI− areas, after exclusion of patients without AFI positivity (n=35) and those with diffuse AFI positivity (n=8). The area under the curve (AUC) for a diagnosis of overall HGD/EC was calculated using the three-biomarker panel from AFI+ areas and AFI− areas in 2000 bootstrap samples from five imputed databases (MI) and the original database (OD). In this plot, each box represents the median AUC with first and third quartiles for the bootstrap samples of each group and the whiskers include data within 1.5 IQR of the upper and lower quartile. Outliers are depicted separately. *** indicates p value <0.001.

