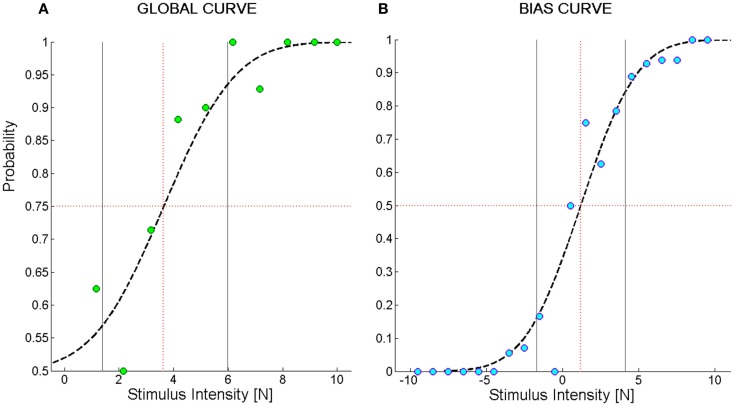
Figure 2.
Example of psychometric curves from the force direction discrimination task. (A) Global Curve; (B) Bias Curve. The ordinate values indicate the probability of perceiving the direction of the force stimulus; the abscissa represents the magnitude of the force stimulus. In (B), negative stimuli stand for forces directed to the left and positive stimuli for forces directed to the right. The green and blue filled circles represent the average probability to perceive the stimulus in the correct direction over bins of 1N. Subject’s responses were fit to a logistic function (dashed black line). The black vertical lines represent the interval of stimuli one standard deviation far from the mean of the Gaussian probability function used to fit the data. We called this interval Spread. The red dotted vertical lines identify the stimulus corresponding to its mean value that we named F85 for (A) and Bias Level for (B).

