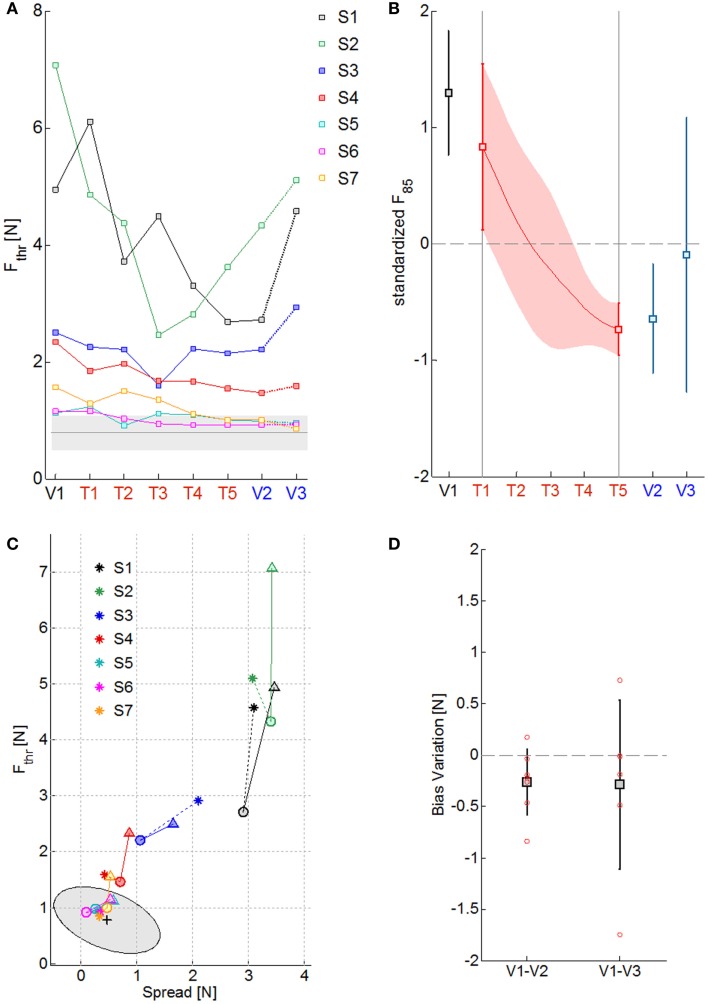
Figure 3.
Summary of the psychometric measures of kinesthetic acuity over sessions. (A) Fthr values along the evaluation (V1–V3) and training sessions (T1–T5) for the seven subjects, identified with different colors. The gray line is the mean Fthr value obtained for the healthy control group and the shaded area the corresponding standard deviation. (B) Standardized F85 values over subjects in the 8 sessions (squares and continuous red line) and their corresponding standard deviation (vertical lines and red shaded area). (C) Effect of training over the psychometric sensitivity (Fthr) and the response uncertainty (Spread): triangles, circles, and asterisks indicate measures obtained respectively at V1, V2, and V3; colors represent different subjects; the mean performance of healthy control subjects is rendered by the black cross and the gray ellipse region represents the ellipse of variation along the principal components of the distribution. (D) Variation in the absolute value of the Bias level from the first to the final evaluation session (V1–V2) and to the follow-up evaluation session (V1–V3): squares stand for the mean variation, the total length of the error bars represent two standard deviations; single subject data are represented by the red circles.

