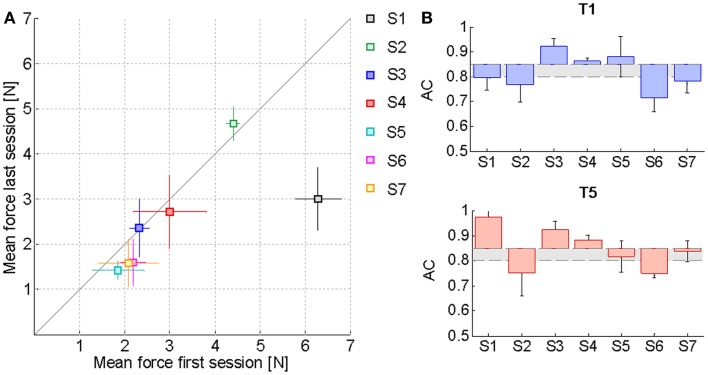
Figure 4.
Effect of training on the assistive force. (A) Mean FPEAK values and corresponding standard deviation over the middle trials of the first training session compared to the last one. The solid line represents the equality condition. Points that lie below the line indicate that the average force needed by the subjects for carrying out the reaching task has diminished, while points above the line denote an increase in the average haptic guidance. (B) Mean AC index variation with respect to the desired level of kinesthetic performance ACd = 0.85 in the first training session (T1) and in the last one (T5). The gray area includes all the AC values within the tolerance margin of 5% allowed below the desired AC percentage. Values have been corrected for the difference between the actual ACd of each subject along a specific direction and the ideal value of 0.85.

