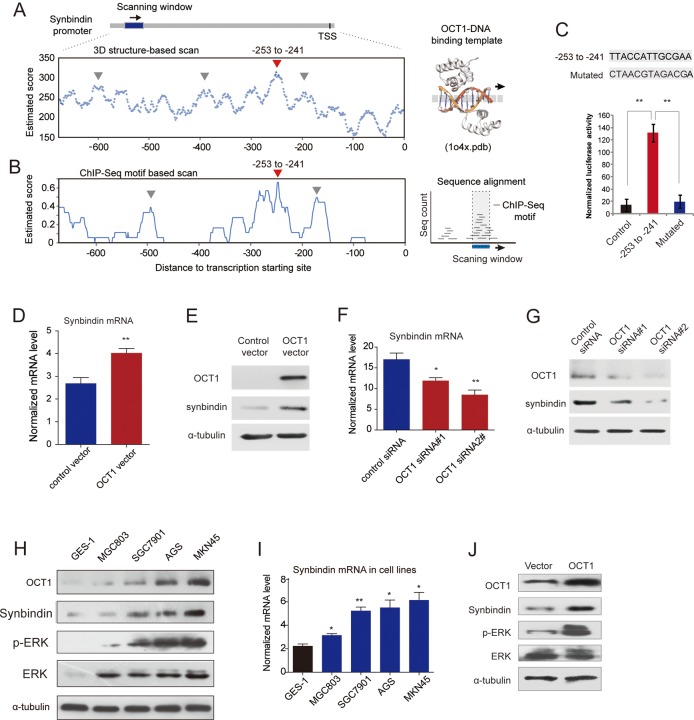
Figure 4.
Transactivation of synbindin by octamer transcription factor 1 (OCT1) and effects on extracellular signal-regulated kinase (ERK) activation. (A) TF-DNA crystallography structure-based prediction of OCT1 binding sites on synbindin promoter (OCT1-DNA complex structure shown on the right). Arrow heads in red and in grey respectively indicate the predicted binding sequence and other sequences tested by luciferase assay. (B) ChIP-seq enriched motif-based prediction of OCT1 binding on synbindin promoter (analysis scheme shown in the right panel). (C) The predicted OCT1-binding sequence (-253 to -241) and its mutated variant (both sequences indicated) were respectively inserted into a luciferase reporter and analyzed for their responses to OCT1. (D) Gastric cancer cells were transfected with OCT1 or control vector, and the mRNA level of synbindin was quantified by qPCR. (E) Western Blot of OCT1 and synbindin of cells treated as described as above. (F) Cells were treated by OCT1 siRNAs and control siRNA, and the level of synbindin mRNA was quantified by qPCR. The 18S rRNA level was used for normalization. (G) Western Blot showing decrease of synbindin protein upon knockdown of OCT1 using specific siRNAs. (H) Western blot showing the expression levels of OCT1, synbindin, p-ERK and ERK in five gastric cell lines. OCT1 expression is upregulated in GC cells as compared to normal gastric mucosa cell GES-1. (I) The mRNA level of synbindin in gastric cell lines was detected by RT-qPCR. (J) Cells were transfected by OCT1 or control vector, followed by Western Blot analysis using specific antibodies for synbindin, phosphorylated ERK (pERK) or total ERK.

