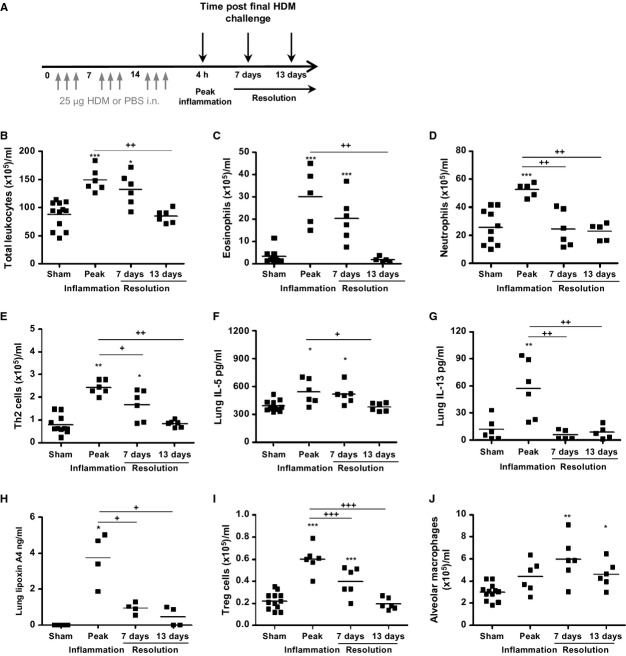
Figure 4.
Alveolar macrophages are elevated concomitant with the resolution of mucosal inflammation (A) Schematic depicting PBS or HDM, (B) total tissue leukocytes, (C) eosinophils, and (D) neutrophils were quantified by differential counting. (E) Th2 lymphocytes quantified by flow cytometry. Th2 cytokine levels in lung tissue homogenate were quantified by ELISA (F) IL-5 and (G) IL-13. (H) LC/MS/MS was used to quantify lung tissue lipoxin A4. (I) CD4+CD25+FoxP3+ T-regulatory lymphocytes and (J) alveolar macrophages were quantified by flow cytometry. At each time point n = 4–12 mice/group. *P < 0.05, **P < 0.01, and ***P < 0.001 relative to PBS control group by Mann–Whitney U-test. +P < 0.05, ++P < 0.01, and +++P < 0.001 relative to peak inflammation, 4-h time point group by Mann–Whitney U-test.

