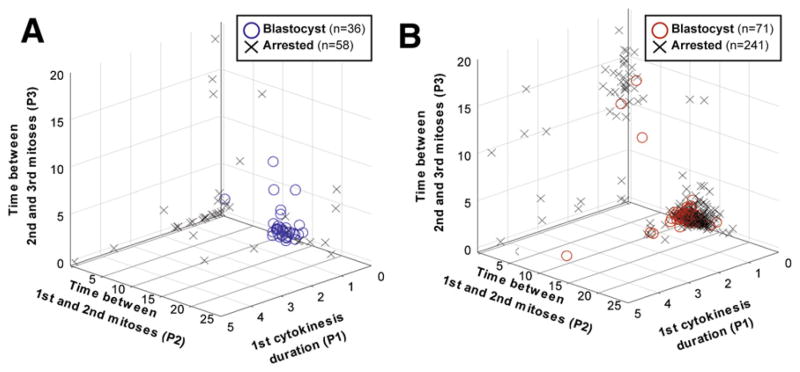
FIGURE 2.
Time-lapse markers used for blastocyst prediction by the 4-cell stage in basic and molecular research (A) and a multicenter clinical validation study (B). Plots show that blastocysts mostly cluster tightly in a specific region for first cytokinesis duration (P1), the time between first and second mitosis (P2), and the time between the second and third mitosis (P3), while arrested embryos are mostly scattered. The time-lapse markers are plotted in units of hours.

