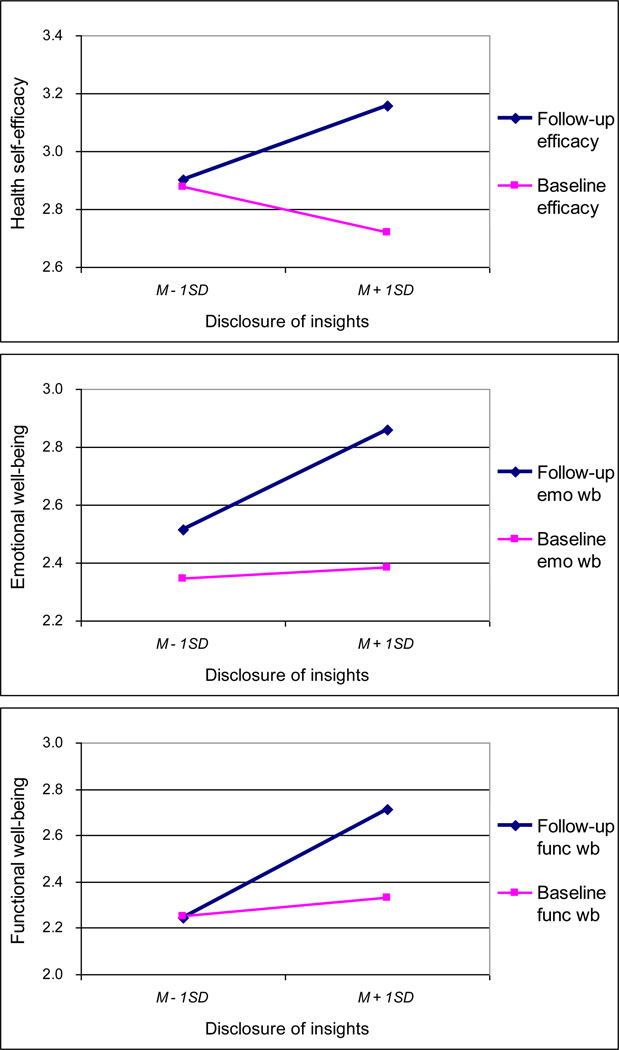
Figure 1.
Disclosure of insights and improvements in health outcomes
Note. N = 106. The y-axis represents health outcomes assessed at either follow-up or baseline. Follow-up values refer to the predicted values acquired from multiple regressions reported in Table 3 (M = 3.06, SD = .44, health self-efficacy; M = 2.69, SD = .59, emotional well-being; M = 2.48, SD = .74, functional well-being). Baseline values refer to the predicted values from regression disclosure of insights as a predictor with other controls (M = 2.80, SD = .34, health self-efficacy; M = 2.37, SD = .43, emotional well-being; M = 2.29, SD = .67, functional well-being). The x-axis indicates disclosure of insights in online groups (M = 1.53, SD = .41).

