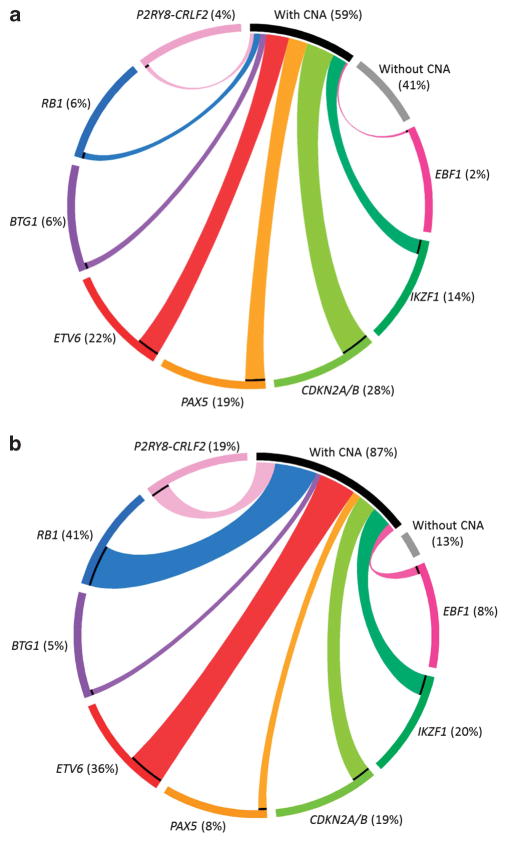
Figure 1.
Circos plots showing the relative distribution of the significant copy number changes in a comparator cohort of childhood BCP-ALL (a) and iAMP21 patients (b). In both (a) and (b) the black bar indicates the proportion of patients in which a copy number abnormality (CNA) was detected compared to the proportion without (grey bar). The proportions of CNA affecting the genes tested are colour coded as indicated. PAR1 deletions represent P2RY8-CRLF2.

