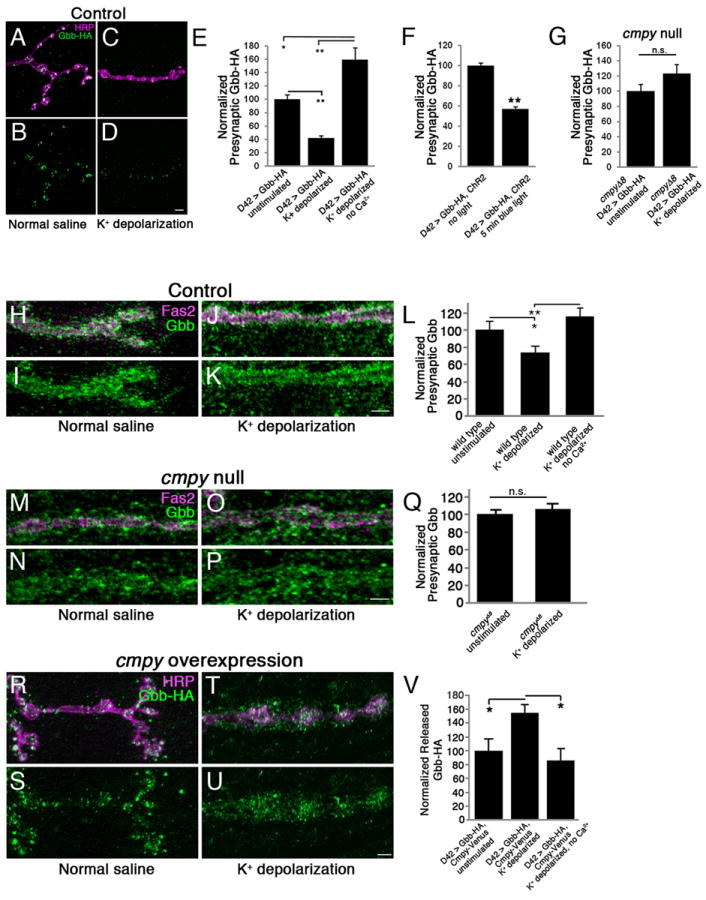
Figure 4. Activity-dependent Gbb release requires Crimpy.

(A-D) Representative confocal images of boutons at NMJ4 in UASGbb-HA; D42Gal4 larvae stained with anti-HRP (neuronal membrane) and anti-HA (Gbb-HA). Before fixation, larvae were incubated for five minutes in normal (A,B) or 90 mM K+ (C,D) saline. (E) Quantification of the Gbb-HA/HRP ratio in UASGbb-HA; D42Gal4 larvae for the indicated conditions (n > 50 NMJs for each). High K+ depolarization results in decreased intracellular Gbb-HA. (F) Quantification of the Gbb-HA/HRP ratio in UASGbb-HA; D42Gal4/UASChR2.S. larvae (n > 40 NMJs for each). ChR2-induced depolarization promotes Gbb release. (G) Quantification of the Gbb-HA/HRP ratio in UASGbb-HA; D42Gal4, cmpyΔ8/cmpyΔ8 larvae (n > 40 NMJs for each). High K+ stimulation does not drive Gbb release in cmpyΔ8 mutants. Scale bars are 5 μm. * p<0.05, ** p<0.01, n.s. not significant. Error bars are SEM. (H-K) Representative confocal images of boutons at NMJ4 in wild-type larvae stained with anti-Fas2 (neuronal membrane) and anti-Gbb (Gbb). Before fixation, larvae were incubated for five minutes in normal (H,I) or 90 mM K+ (J,K) saline. Wild type is Oregon R. (L) Quantification of presynaptic Gbb. Mean pixel intensity of Gbb inside the presynaptic terminal as defined by Fas2 is reduced 25% following stimulation in high K+ saline. (n = 8 NMJs for each). (M-P) Representative confocal images of boutons at NMJ4 in cmpyΔ8 homozygous larvae stained with anti-Fas2 (neuronal membrane) and anti-Gbb (Gbb). Before fixation, larvae were incubated for five minutes in normal (M,N) or 90 mM K+ (O,P) saline. (Q) Quantification of presynaptic Gbb as defined in (L). No change is observed following stimulation (n > 9 NMJs for each). (R-U) Representative confocal images of boutons at NMJ4 in UASGbb-HA; D42Gal4/UASCmpy-Venus larvae stained with anti-HRP (neuronal membrane) and anti-HA (Gbb-HA). Before fixation, larvae were incubated for five minutes in normal (R,S) or 90 mM K+ (T,U) saline. (V) Quantification of the released Gbb-HA/HRP ratio. Mean pixel intensity of Gbb-HA outside of presynaptic terminal as defined by HRP, but within a 2.5 μm perimeter surrounding the terminal, is increased 50% following stimulation in high K+ saline. No increase is observed when Ca2+ is removed from the high K+ buffer. (n = 10 NMJs for each). Scale bars are 2 μm. * p<0.05, ** p<0.01, n.s. not significant. Error bars are SEM.
