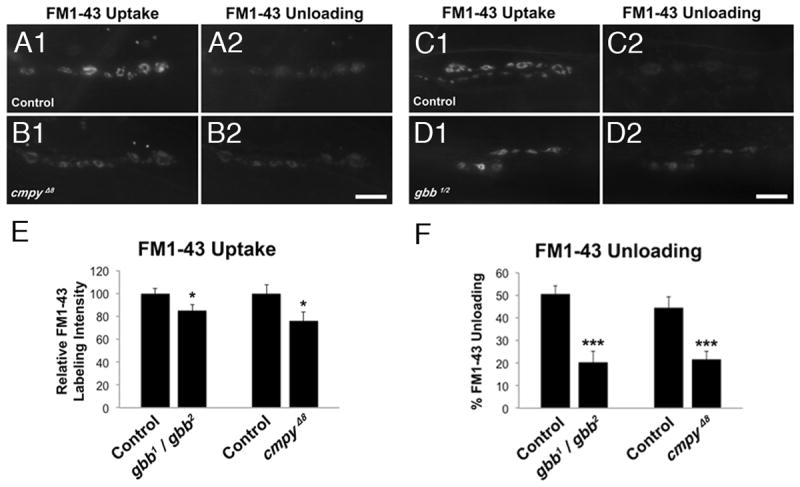
Figure 6. Crimpy and Gbb are comparably required for synaptic vesicle cycling.

(A1-D2) Representative images of FM1-43 dye uptake (A1, B1, C1, D1), and dye unloading (A2, B2, C2, D2), after 90mM K+ depolarization with and without dye in the bath, respectively. Control is heterozygous parental PBac elements, PBacf01736/PBacf02482 in (A1-A2) and Canton-S in (C1-C2). Scale bars: 10μM. (E) Quantification of normalized FM1-43 labeling intensity after dye uptake for the indicated genotypes. (F) Quantification of the ratio of FM1-43 dye unloading to loading for the indicated genotypes. n > 20 NMJs scored. * p<0.05, ***, p<0.001, n.s. not significant. Error bars are SEM.
