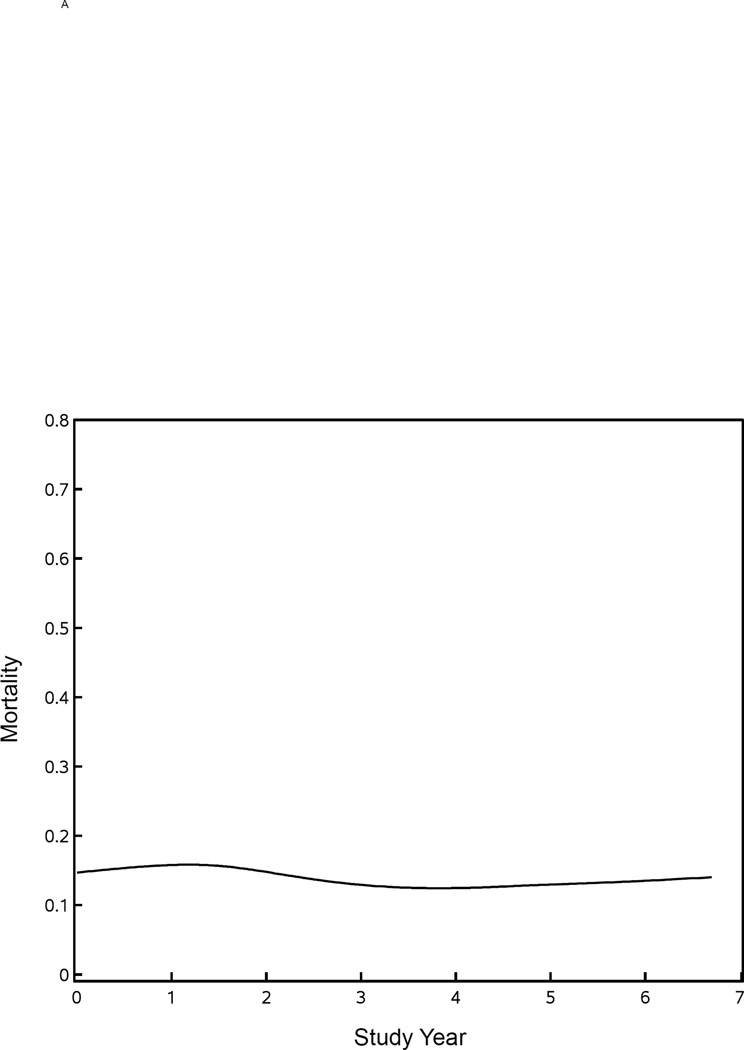
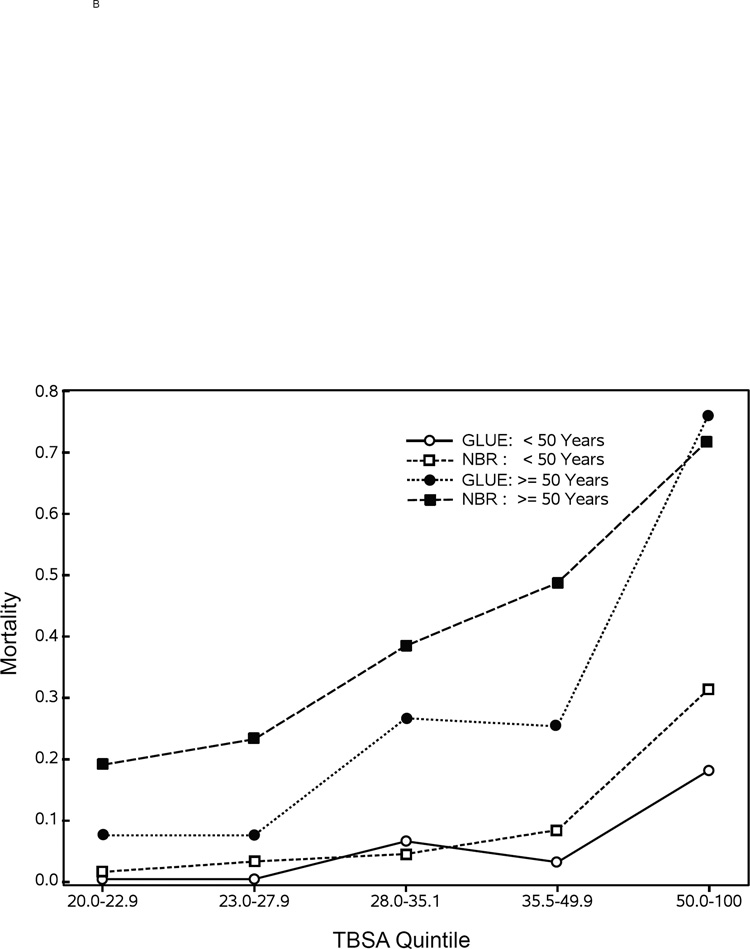
Figure 2. Mortality for Glue Grant study patients compared with the NBR.
Panel A shows the mortality rate by year for those patients in the Glue Grant study. Comparisons of mortality rates by TBSA quintile and age group (<50 years old versus ≥50 years old) for those patients in the Glue Grant with those in the NBR are shown in panel B.


