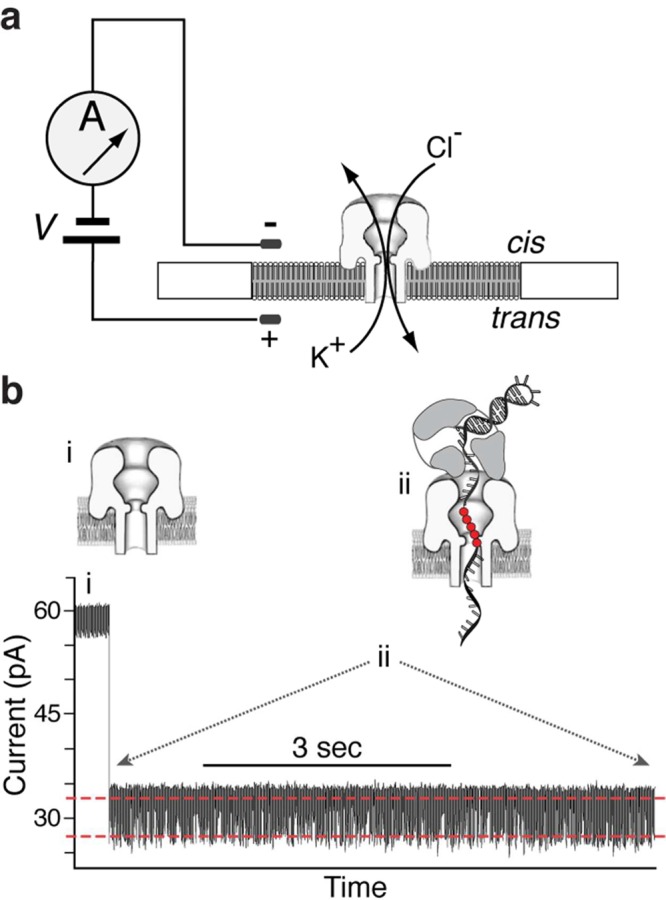
Figure 2.

Capturing and measuring individual Φ29 DNAP complexes on the α-HL nanopore. In the nanopore device (a), a single α-HL nanopore is inserted in a ∼25 μm-diameter lipid bilayer separating two chambers (cis and trans) that contain buffer solution. A patch clamp amplifier applies voltage across the bilayer and measures ionic current, which is carried through the nanopore by K+ and Cl– ions. (b) Representative current trace for an individual binary complex of Φ29 DNAP and a DNA substrate (DNA1-H_H, in Figure 3b(i)), formed in the bulk phase in the cis chamber and captured at 180 mV. Cartoons above the current trace illustrate the sequence of events, which is described in the text. In the cartoons, a reporter group of five consecutive abasic (1′, 2′-H) residues is shown as red circles. In the plot of ionic current vs time, the two red dashed lines indicate the two amplitude levels between which the current fluctuates (detailed views of current traces are shown in Figure 3).
