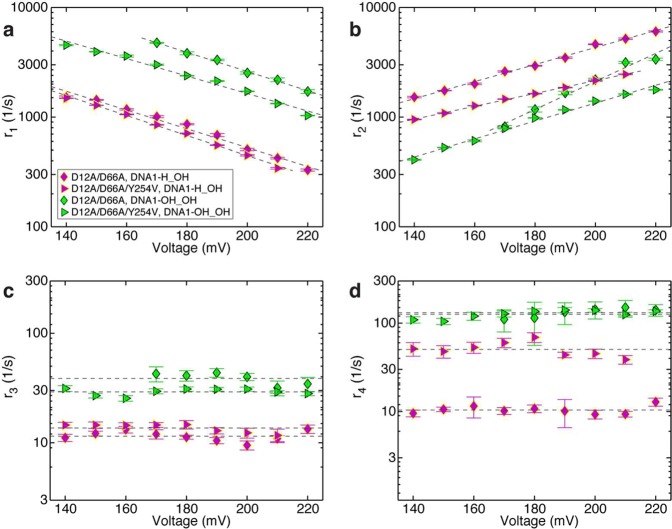
Figure 6.
Effects of a 2′-OH, 3′-OH primer terminated substrate on the rates of translocation and primer strand transfer between the polymerase and exonuclease sites. Plots of (a) log(r1) vs voltage, (b) log(r2) vs voltage, (c) log(r3) vs voltage, and (d) log(r4) vs voltage for complexes formed between DNA1-H_OH (magenta symbols) or DNA1-OH_OH (green symbols) and D12A/D66A (◆) or D12A/D66A/Y254V (▶) Φ29 DNAP. Rates were determined from dwell time samples extracted from ionic current traces and a three-state kinetic model40 consisting of transitions r1, r2, r3, and r4 in the model diagram in Figure 1a. Errors bars indicate the standard error.

