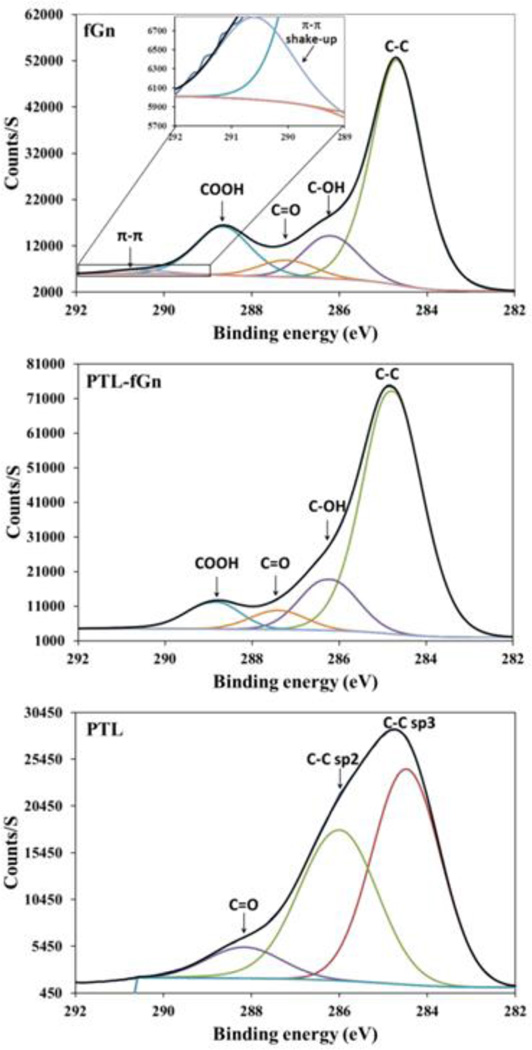
Figure 3.
XPS analysis of fGn, PTL-fGn, and PTL itself. The black traces in each graph represent the C1s signal measured for each material. The peaks below the black traces represent mathematical models of the underlying signals for each moiety (i.e. π-π shake up; C=O, C-OH, COOH, and C-C bonds.) The upper panel contains an inset to show signal representing π-π shake up more detail.

