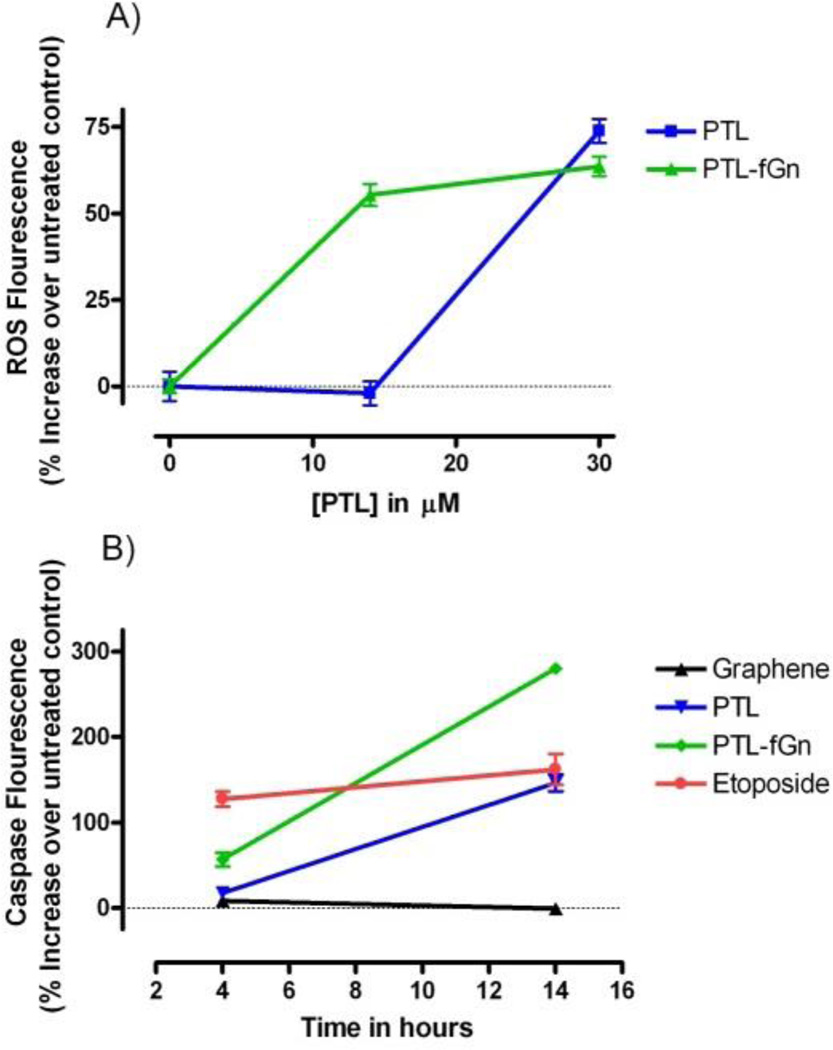
Figure 7.
A) ROS generation. % increases in ROS levels induced by treatment with by PTL and PTL-fGn after 24 hour incubation are shown. No increase was seen when cells were treated with fGn (10 µg/ml) alone. B) Caspase activation. Caspase activity was measured by fluorescence plate reader after 4 and 14 h incubation with PTL and PTL-fGn. Untreated cells and cells treated with only fGn were included as negative controls, and etoposide (100 µM) was included as a positive control.

