
Figure 3. Cardiac events-free survival curves categorized by whether PIIINP level is higher (upper curve) or less (lower curve) than 5.09 (median value).
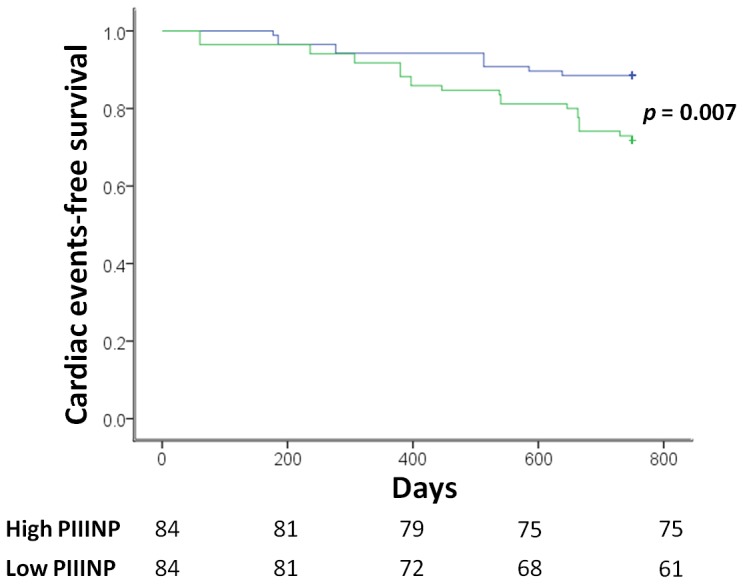
Number of patients at risk during follow-up is indicated below the x axis.
Official websites use .gov
A
.gov website belongs to an official
government organization in the United States.
Secure .gov websites use HTTPS
A lock (
) or https:// means you've safely
connected to the .gov website. Share sensitive
information only on official, secure websites.
Number of patients at risk during follow-up is indicated below the x axis.