
Figure 8. KEGG enrichments of the annotated DEGs across three comparisons.
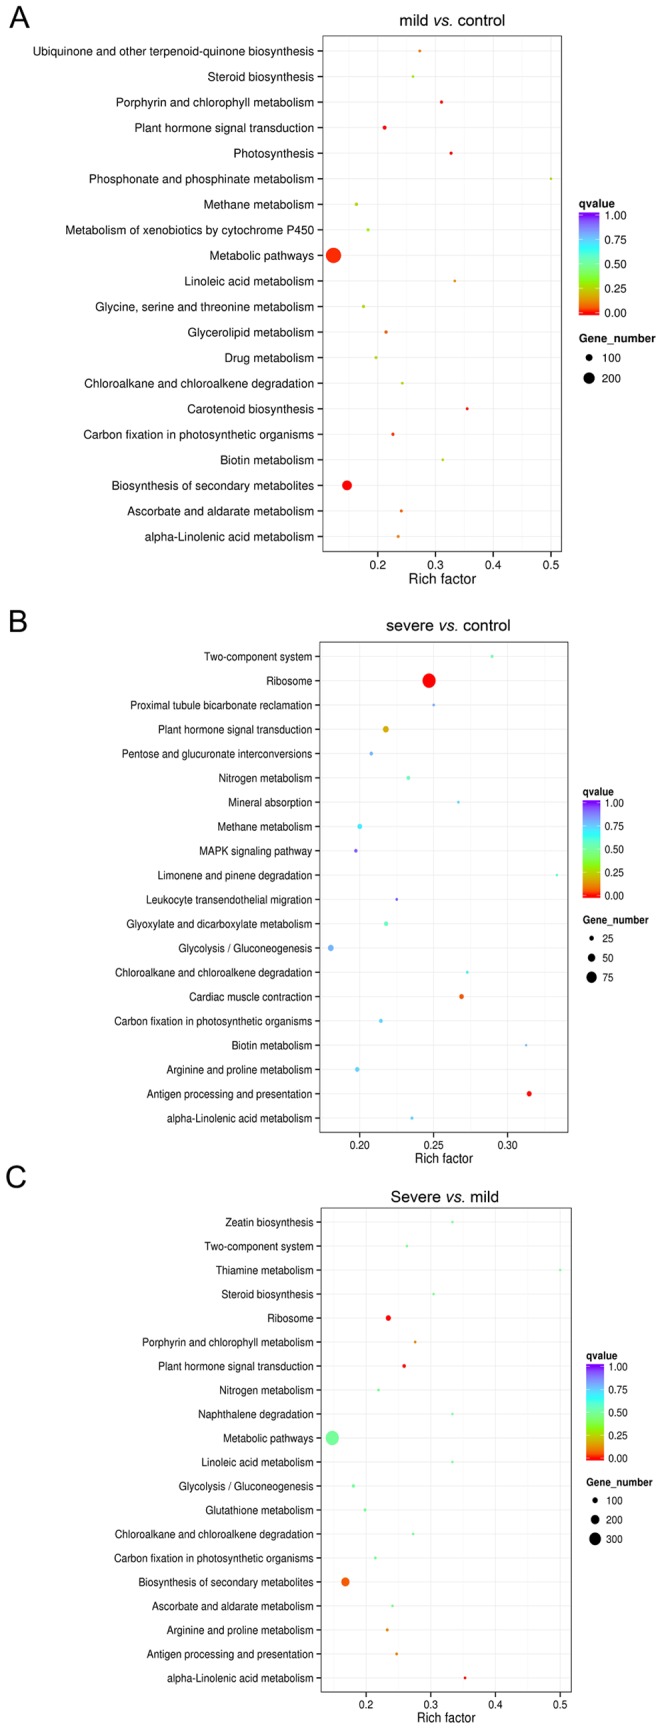
The left Y-axis indicates the KEGG pathway. The X-axis indicates the Rich factor. A high q value is represented by blue, and a low q value is represented by red. A, mild stress versus control; B, severe stress versus control; C, severe stress versus mild stress.