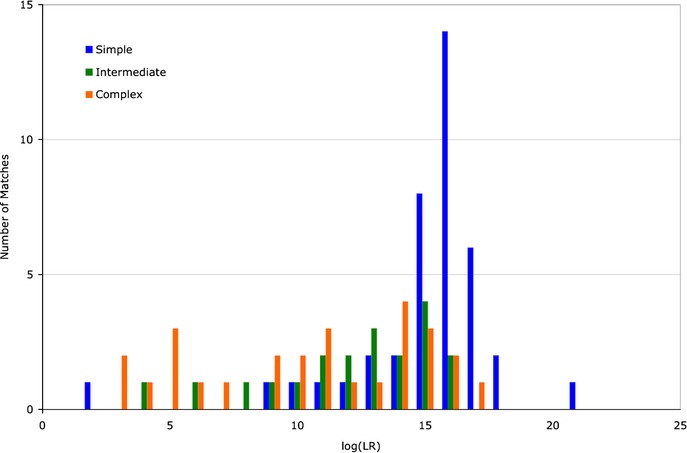
Fig 2.

Genotype information sensitivity. The distribution of genotype match information (as inferred by TrueAllele) is shown as a log(LR) histogram of counts for each complexity category, with theta at 1%. The simple items (blue) are distributed more to the right than the intermediate items (green). The leftmost distribution is for the complex items (orange), which tend to be less informative.
