
Fig 5.
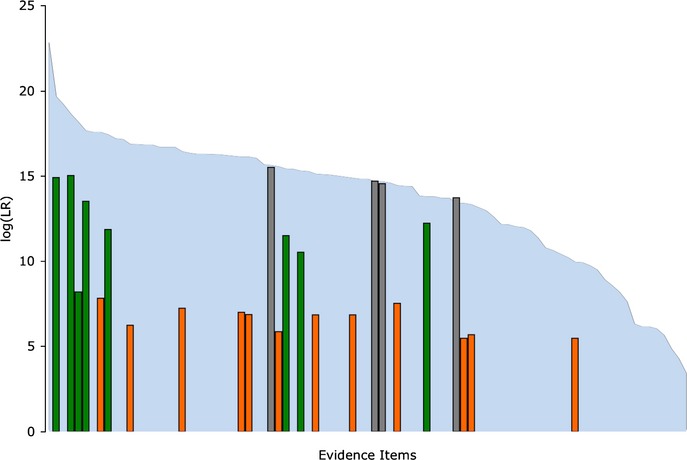
Computer versus human match information. The blue background shows the computer-inferred match information for each genotype, as in Fig.4. The foreground bars show logarithms of human match statistics obtained on the same DNA mixture genotypes. The human review methods used were conditional match probability (CMP) (gray), combined likelihood ratio (CLR) (green), and combined probability of inclusion (CPI) (orange). The TrueAllele LRs were calculated with theta at 0% for CLR and CPI and at theta = 3% for CMP, to correspond to the reported laboratory results.