
Fig 7.
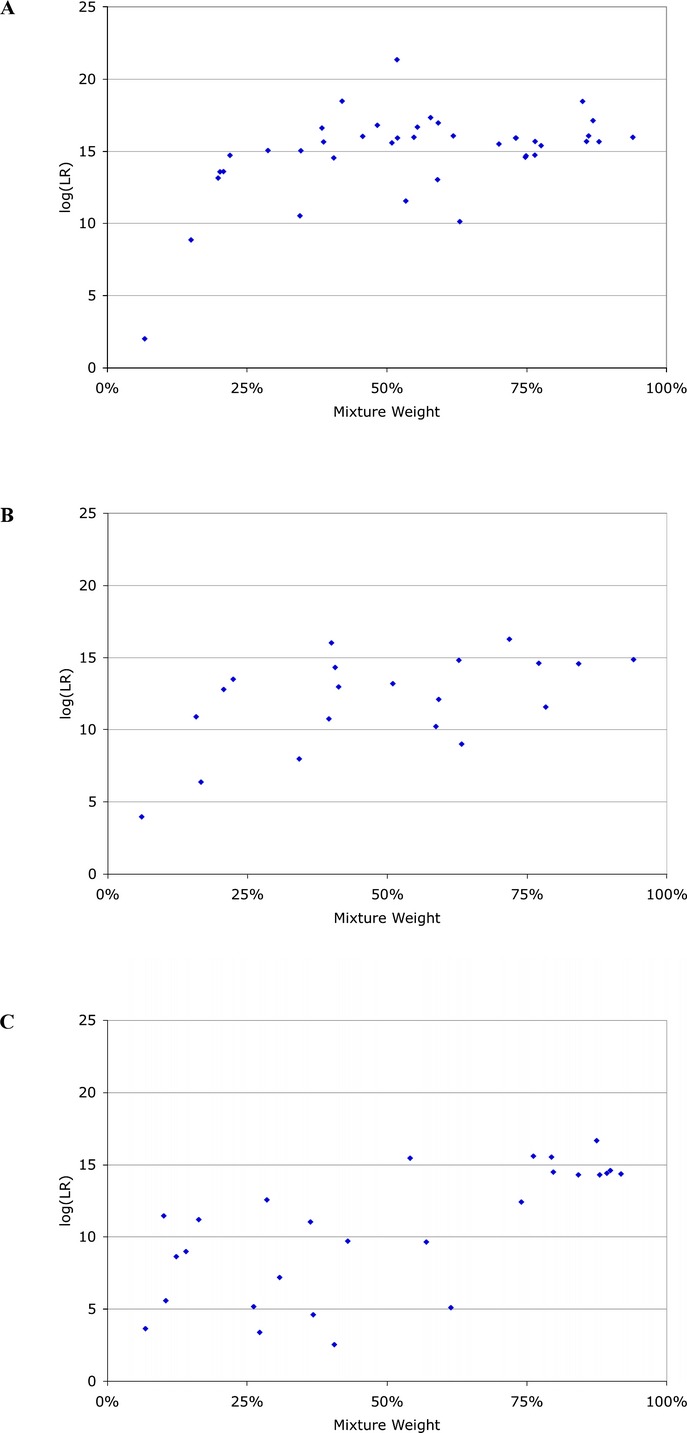
Mixture weight versus information. For each category, a scatter plot is shown of information versus mixture weight for all genotypes in that category. The (A) simple items tend to have more identification information and higher mixture weights than other items. The (B) intermediate items have less information and lower mixture weights, while the (C) complex items have the least information, on average. The likelihood ratio values were calculated with theta at 1%.